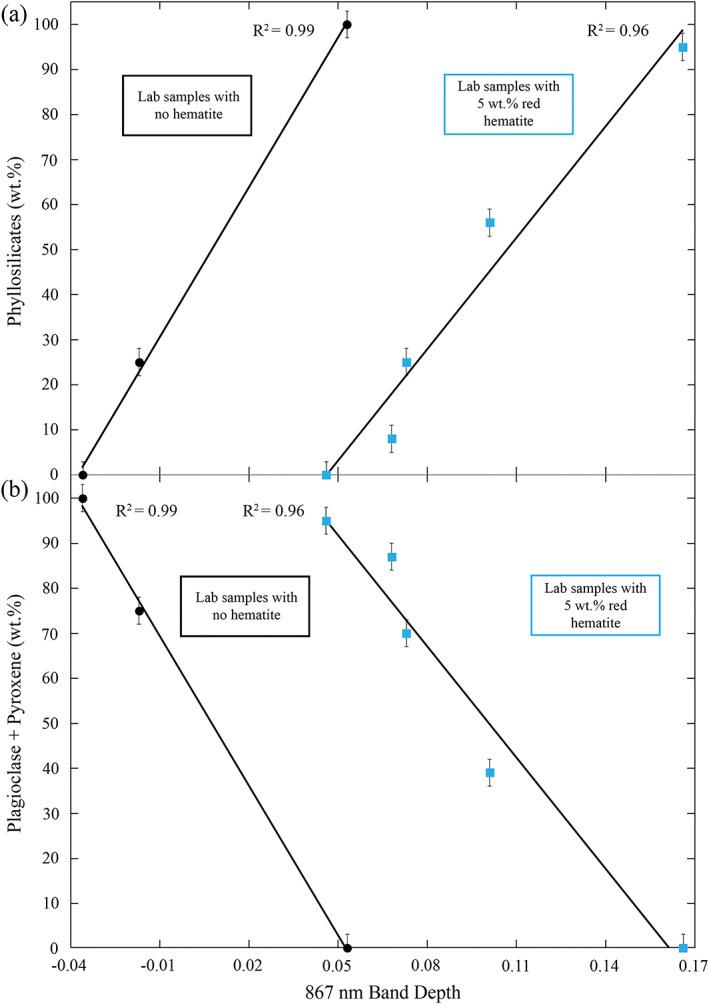
Figure 16.

Comparison of band parameters and mineral abundances of lab mixtures. Blue squares are mixtures with 5 wt.% red hematite, and black circles are mixtures with 0 wt.% hematite. (a) Strong positive correlation between phyllosilicate abundance and 860 nm band depth in the laboratory mixtures (Table 2). (b) Strong negative correlation between plagioclase + pyroxene abundance and 860 nm band depth in the laboratory mixtures (Table 2).
