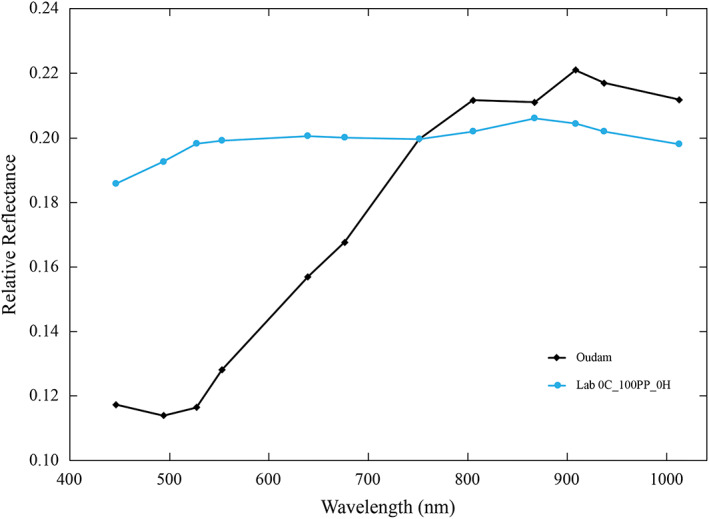
Figure 18.

Comparison of the Oudam drill tailings (black diamonds) to the lab mixture (blue circles) with only plagioclase and pyroxene. Lab spectrum scaled to Oudam at 751 nm. The y‐axis error bars are about the size of the markers for both the Mastcam and lab spectrum.
