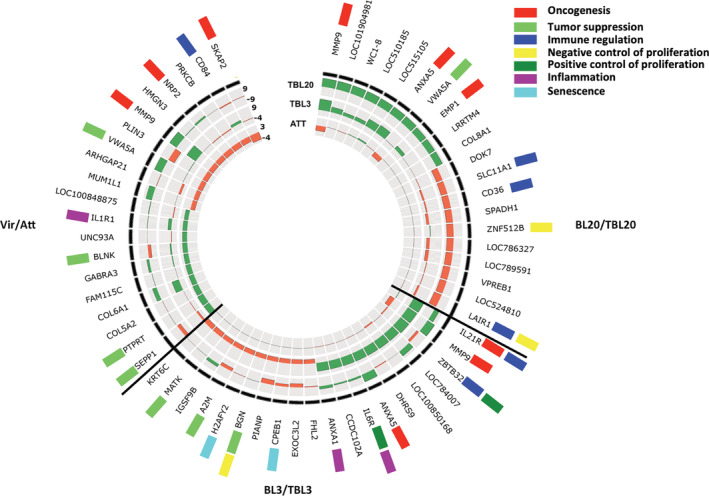
FIGURE 1.

Top 20 DEGs in Theileria‐transformed bovine host cells. Circos plot showing the top 10 up‐ and down‐regulated DEGs in BL3/TBL3, BL20/TBL20 and attenuated versus virulent (Att/Vir) Ode macrophages. The circular heatmap represents the FC of the top DE genes in BL20/TBL20, BL3/TBL3 and Att/Vir Ode in the outer, middle and inner rings, respectively, where green reflects the level of up‐regulation and orange down‐regulation. The genes with biological functions related to tumorigenesis and immune regulation are tagged with coloured rectangles. Genes with no tag are hypothetical genes or have no known function in tumorigenesis and immune regulation. DE, differentially expressed; DEG, differentially expressed gene; FC, fold change
