FIGURE 5.

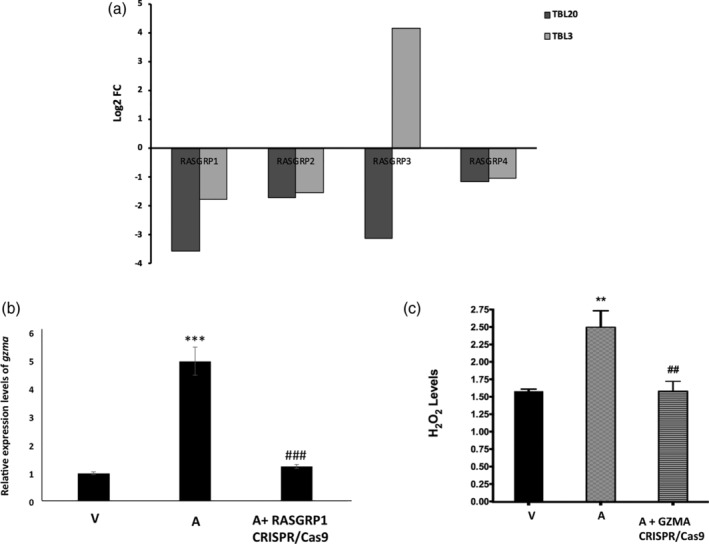
RASGRP1 and GZMA knockdown reduces GZMA expression and dampening of H2O2 levels, respectively. (a) Log2FC values of RASGRP1‐4 in TBL3 and TBL20 RNAseq Log2FC values from DESeq2 of TBL3 and TBL20 compared to BL3 and BL20, respectively. (b) Effect of RASGRP1 knockdown on GZMA expression. qRT‐PCR of GZMA in virulent (V), attenuated (A) and attenuated Ode macrophages after CRISPR/Cas9‐mediated RASGRP1 knockdown. Error bars represent SD of three biological replicates *** and ### represent p < .001 compared to virulent and attenuated Ode macrophages, respectively. (c) H2O2 output by virulent (V), attenuated (A), and attenuated Ode macrophages after CRISPR/Cas9‐mediated GZMA knockdown. Error bars represent SD of three biological replicates. ** and ## represent p < .01 compared to virulent and attenuated Ode macrophages, respectively. FC, fold change
