FIGURE 6.

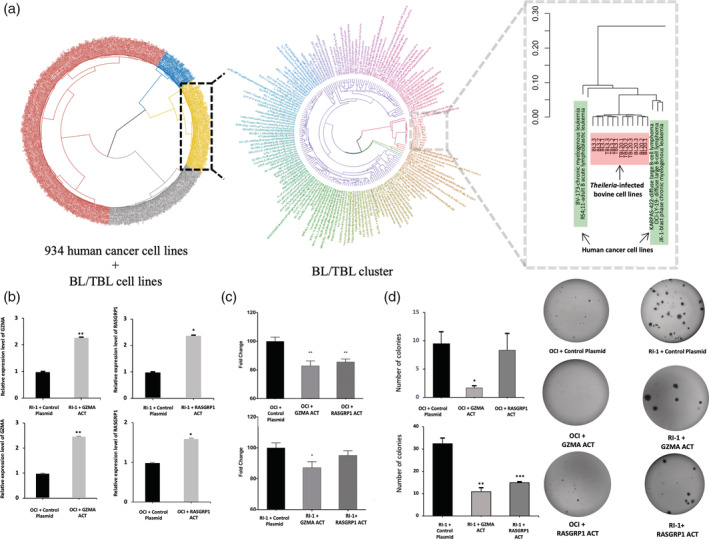
Effect of GZMA and RASGRP1 activation on human B lymphomas. (a) (Left panel) PCA based hierarchical clustering of 934 human cancer cell lines and T. annulata‐transformed bovine B cells and their non‐infected counterparts. The cluster containing bovine cells mainly contains leukaemic human cancer cell lines. The samples are coloured by cluster ID. (Middle cluster) The samples from the BL3/TBL3 and BL20/TBL20 sub‐cluster were reclustered by comparing the similarity of their gene expression profiles. The sample labels are coloured by their similarity to each other. (Right panel) The sub‐cluster containing bovine cell lines and human cancer cell lines with similar gene expression profile. (b) qRT‐PCR determination of GZMA and RASGRP1 expression after CRISPR‐mediated gene activation in RI‐1 (top panel) and OCI‐LY19 (bottom panel). The error bars represent SEM of three biological replicates. (c) Matrigel chamber assay illustrating the dissemination potential of RI‐1 and OCI‐LY19 following activation of RASGRP1 and GZMA transcription. (d) Decrease in colony formation in soft agar of OCI‐LY19 and RI‐1 following GZMA and RASGRP1 activation. Errors bars represent SEM values of three biological replicates *, ** and *** represent student t test p < .05, p < .005 and p < .0005, respectively
