
Figure 1.
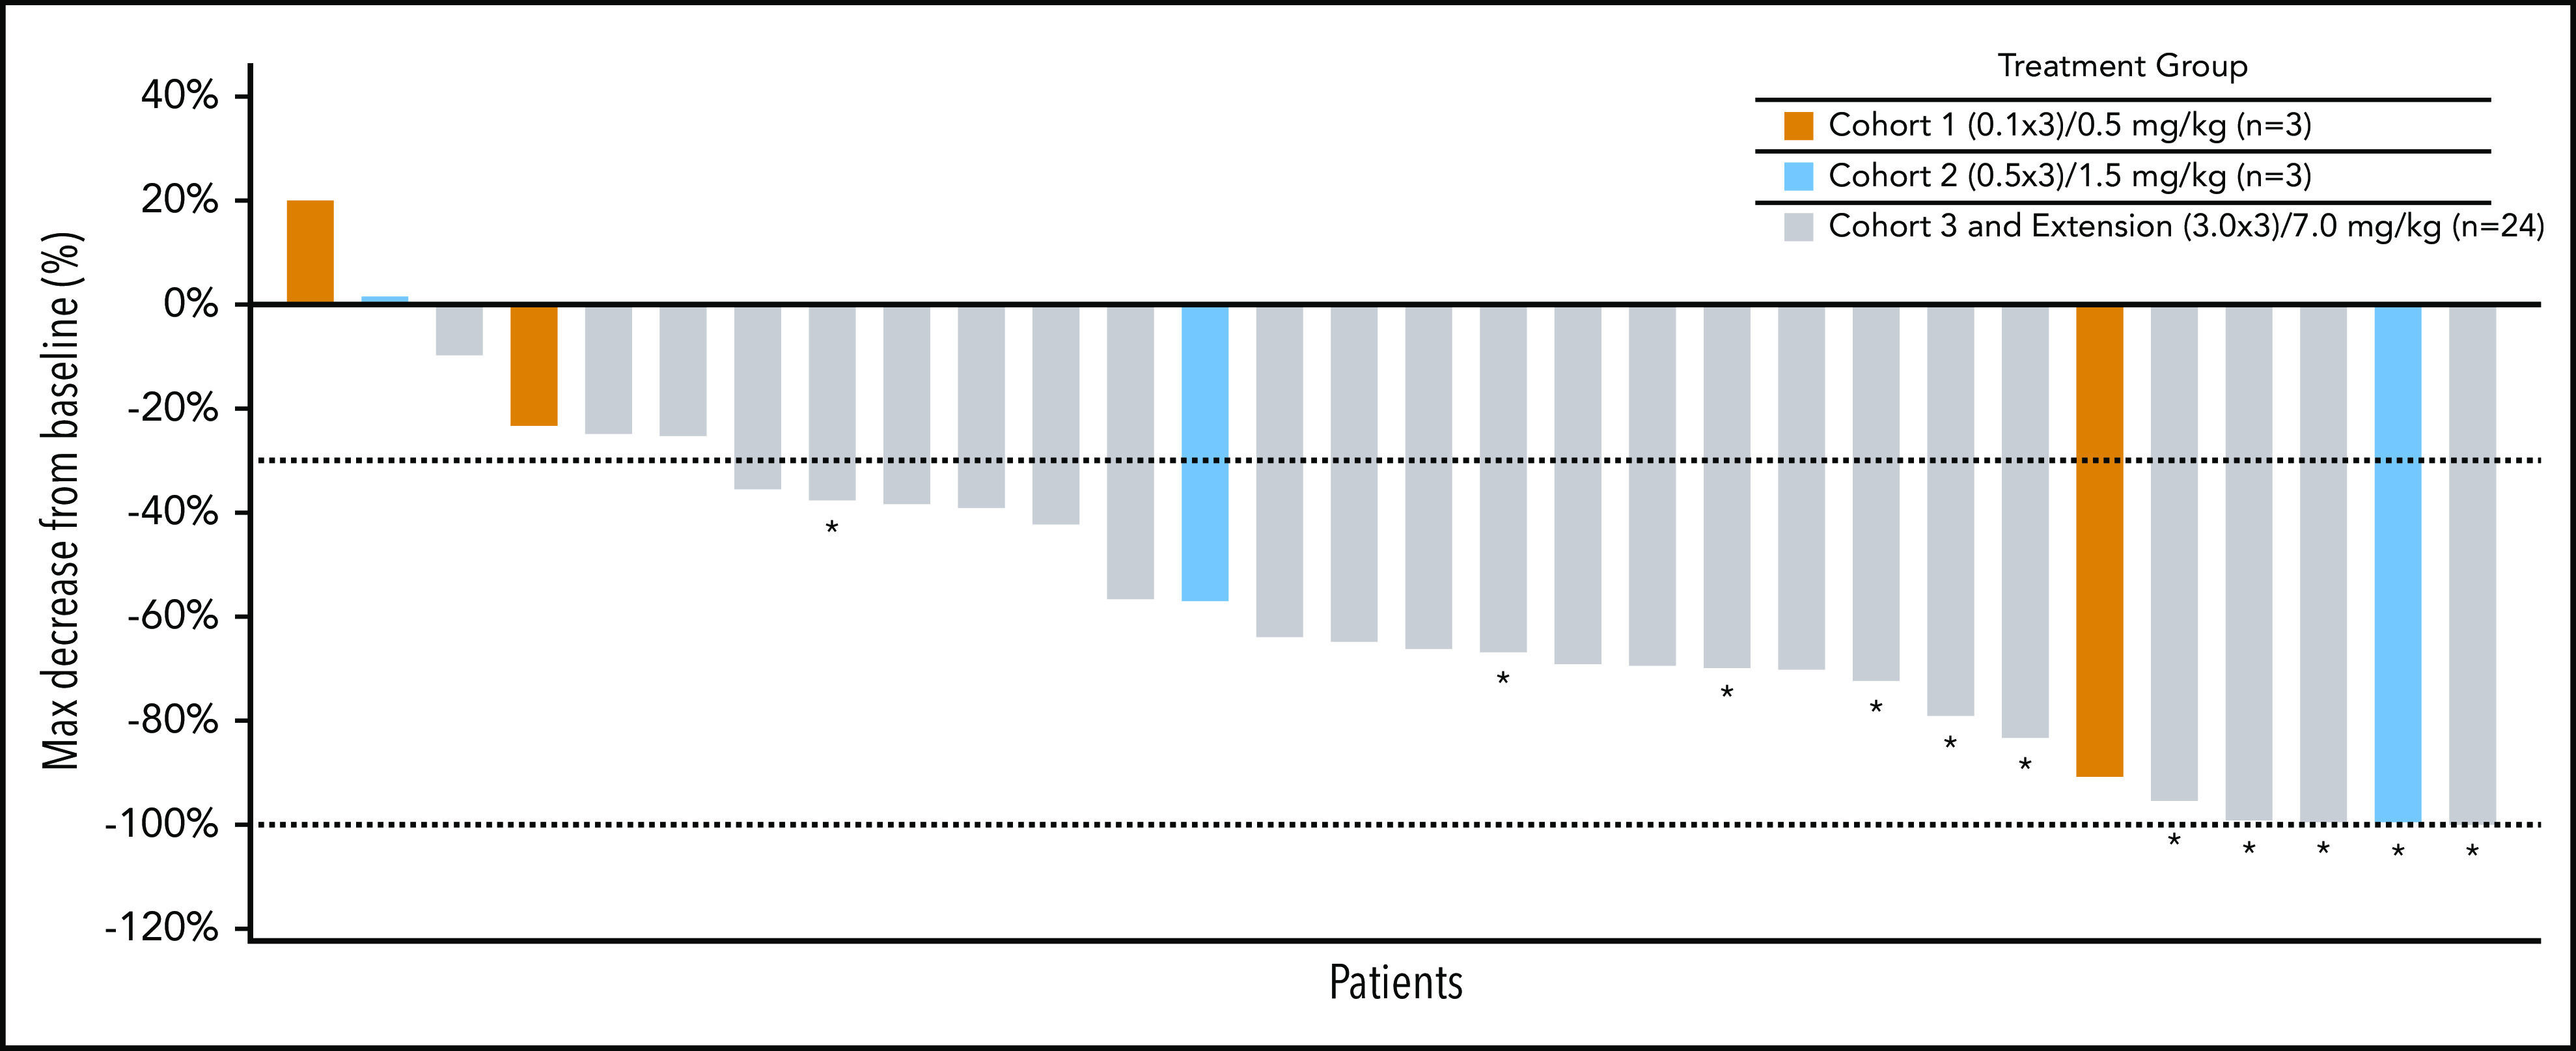
Best response according to tumor volume. The dashed line (−30%) represents clinically meaningful responses (30% reduction from baseline). *All assessments are based on CT scan, CRs are based on PET scans (metabolic assessment) and appear opaque on CT scans. NE, not evaluable; PR, partial response; SD, stable disease.