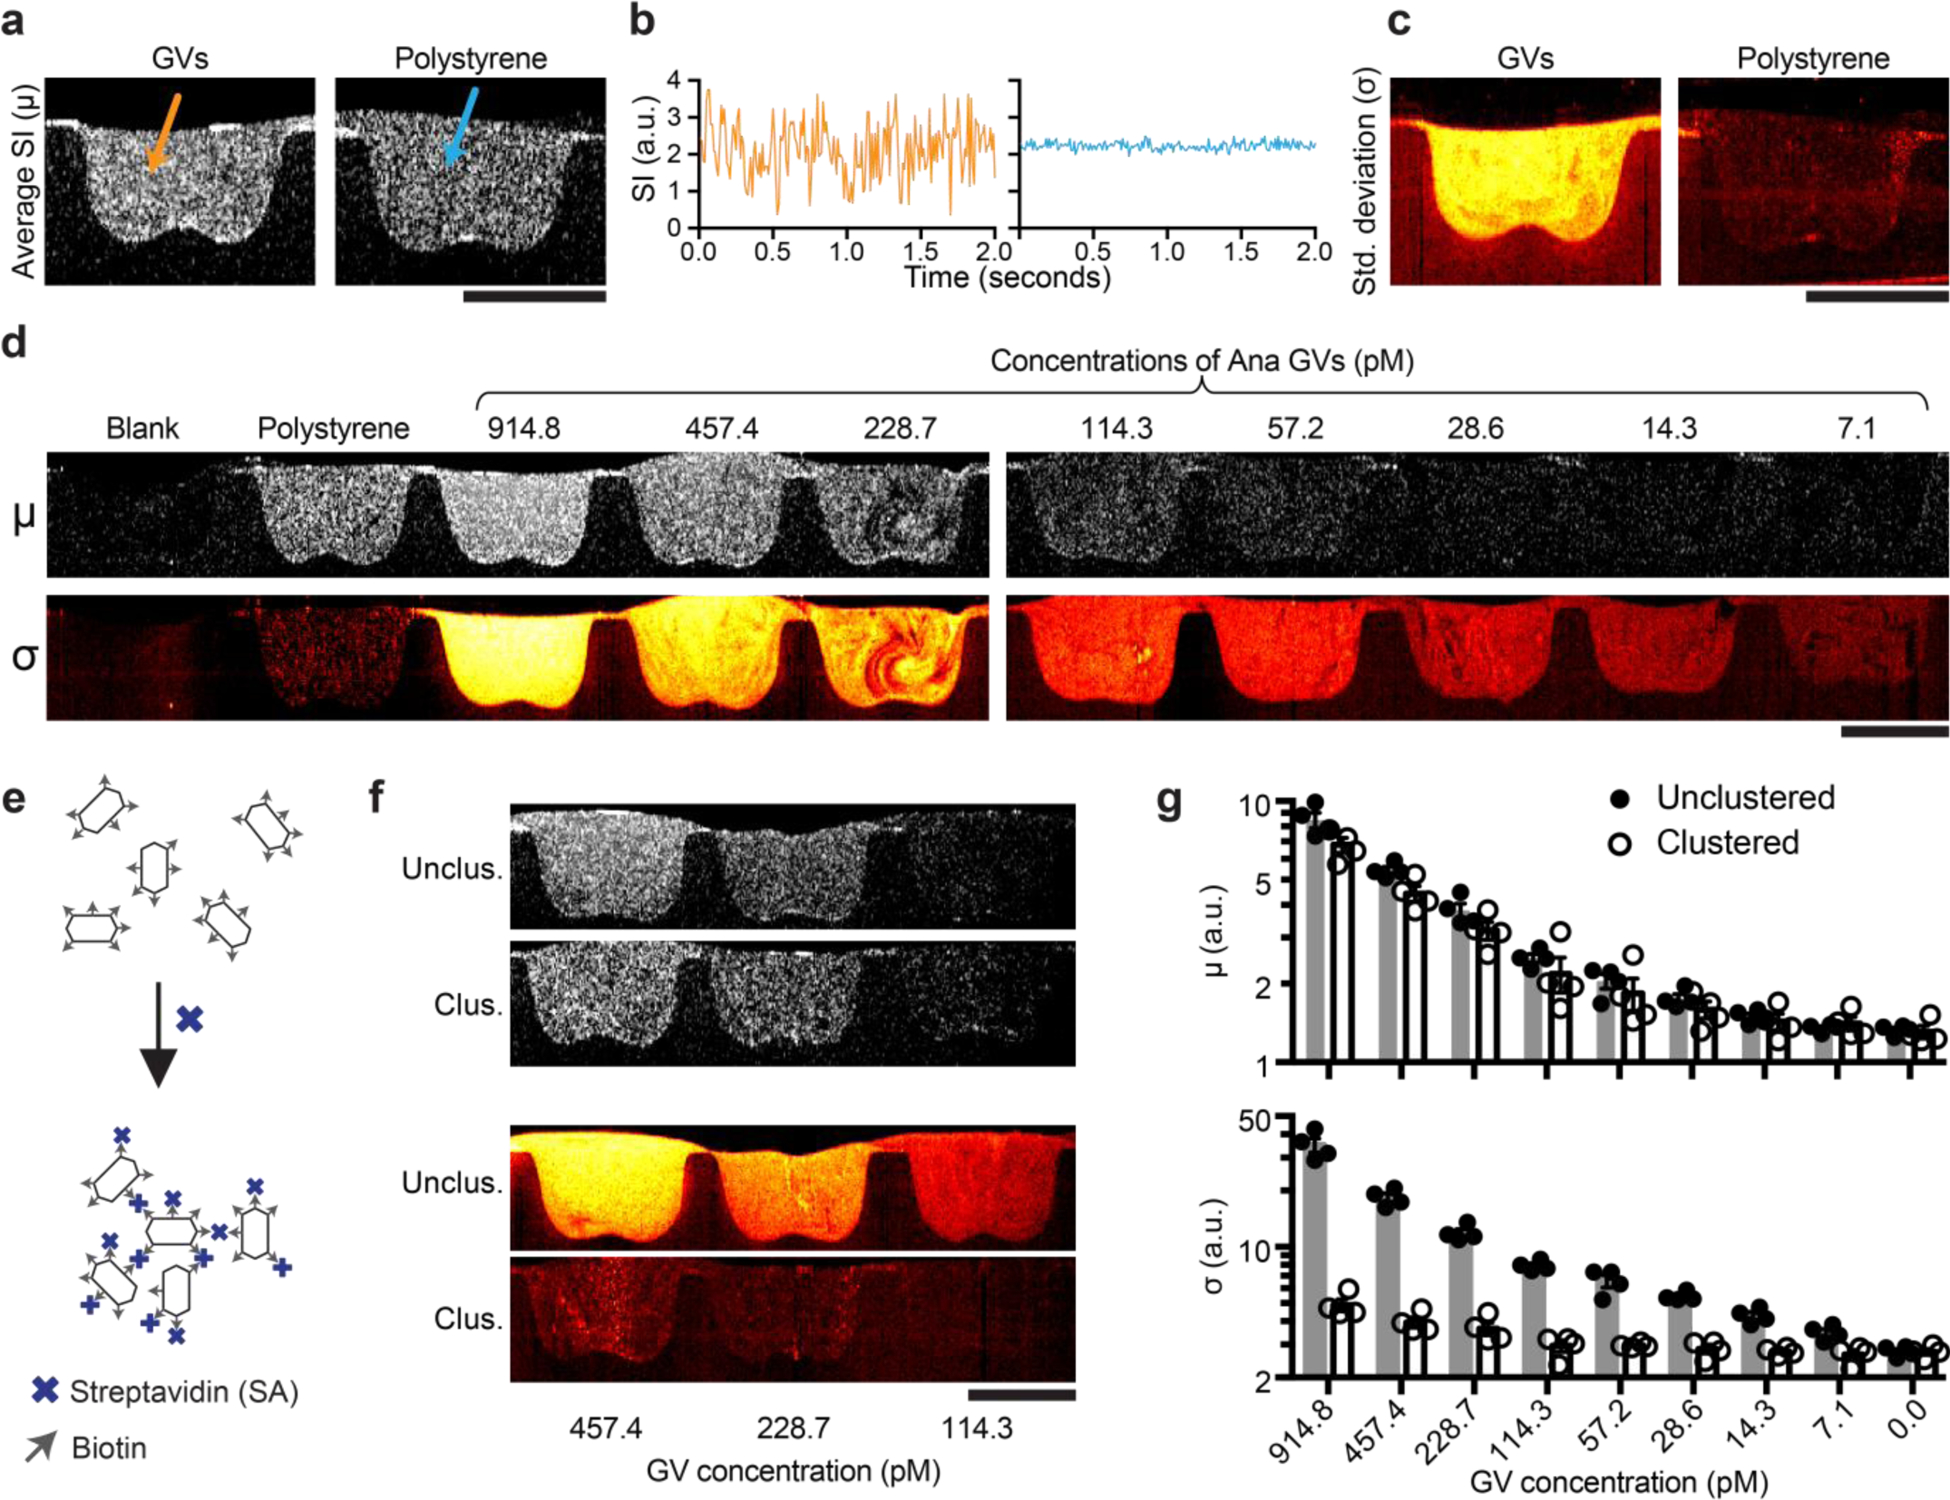
Figure. 2 |. Temporal characteristics of OCT contrast of GVs and GV nanoassembly.

a, Representative pixel-wise average signal intensity (SI) (μ image) of a series of OCT images collected over 2 seconds at 100 fps of Ana GVs and polystyrene particles both of the same concentrations as in Fig. 1h. b, Representative time traces of two individual pixels from region containing either GVs or polystyrene particles. c, Pixel-wise temporal standard deviation (σ image) of the same samples in (a). d, Representative μ and σ images of a concentration series of Ana GVs. e, Diagram of the clustering of surface-biotinylated Ana GVs by streptavidin. f, Representative μ and σ images of clustered and unclustered Ana GVs. g, Mean μ and σ. N = 4 replicates. Error bars represent SEM; scale bars represent 1 mm.
