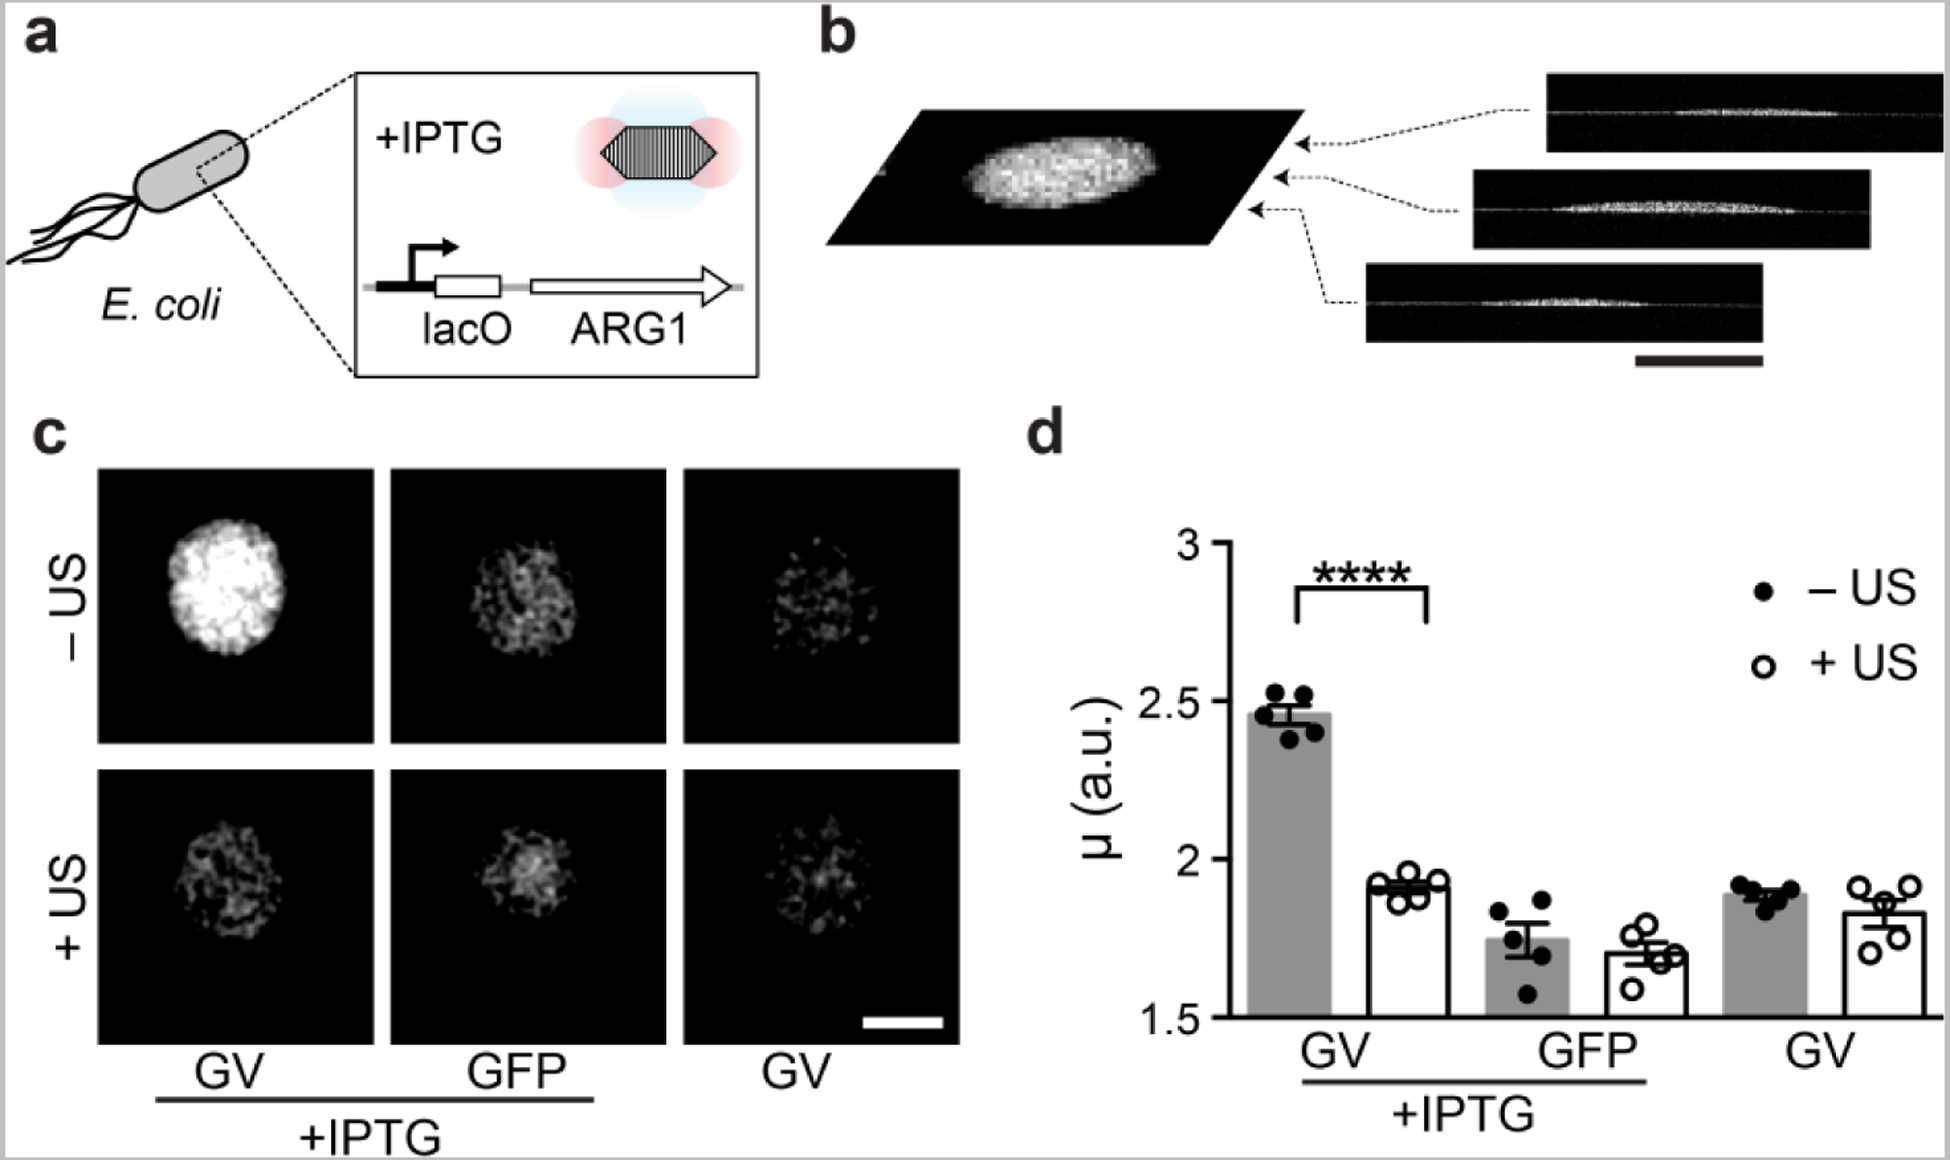
Figure 3 |. OCT reporter gene enables the imaging of gene expression in bacterial colonies.

a, Diagram of the IPTG-inducible expression of ARG1 GVs inside E. coli. b, Representative coronal slice (C-scan image) extracted from 3D volumetric OCT image of an E. coli colony. c, Representative C-scans of colonies expressing GVs or green fluorescent proteins (GFP), in the presence or absence of the inducer, and subjected to ultrasound or left intact. d, Mean average intensity (μ) of E. coli colonies. N = 5 biological replicates. Student’s t-test was performed between GVs with and without ultrasound treatment: p < 0.0001, unpaired, d.f. = 15.56. Error bars represent SEM; scale bars represent 1 mm.
