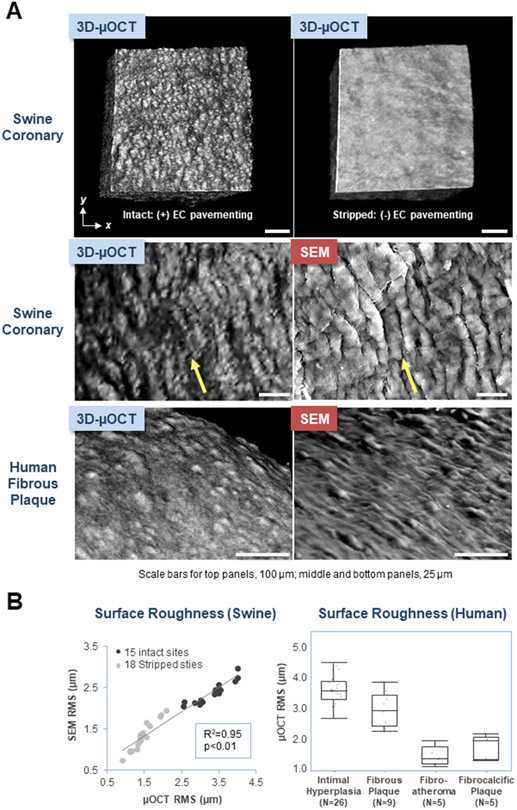
Figure. 3D-μOCT and SEM Images of Coronary Endothelial Cell Morphology.
(A) 3D-μOCT of an intact swine coronary artery showing endothelial pavementing (top left panel). In contrast, a comparatively smooth surface is seen at the site of endothelial stripping (top right panel). Endothelial pavementing of a swine coronary segment and human fibrous plaque visualized by 3D-μOCT is similar to that seen by SEM (middle and bottom panels). Blood flow direction in the images of the swine coronary is depicted using yellow arrows (middle panels), demonstrating an alignment of endothelial cells with flow. Scale bars, 100 μm (upper panels); 25 μm (middle and bottom panels).
(B) Scatter plot showing significant correlations between 3D-μOCT and SEM RMS measurements in both intact and stripped sites (left). Box plot of μOCT RMS for different OCT-delineated coronary lesions (right). Statistical differences were examined using Wilcoxon signed rank test. Intimal hyperplasia RMS (3.6±0.1 μm) was higher than that of fibrous plaque (3.0±0.2 μm) (p<0.01) and both intimal hyperplasia and fibrous plaque RMS were higher than those of fibrocalcific plaque (1.8±0.2 μm) and fibroatheroma (1.5±0.1 μm) (p<0.01).

