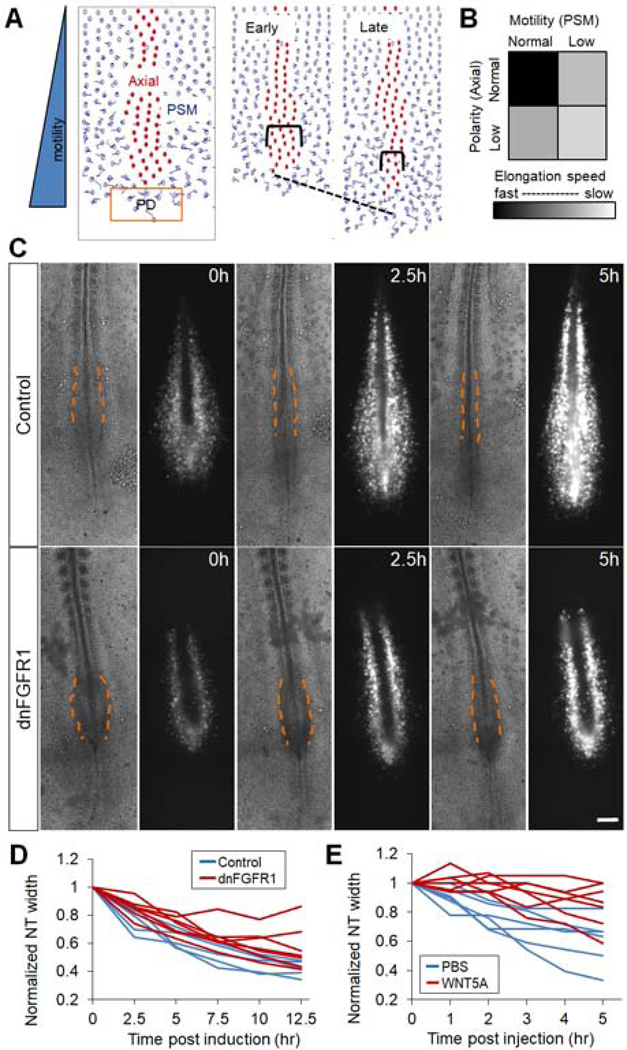
Figure 3.
PSM cell motility and axial cell polarity contribute to axial elongation
(A) Agent-based 2D model for posterior body axis elongation. Cell centroids but not cell shapes are shown for the ease of visualization. NC/NT cells (red) are flanked by PSM cells (blue). New PSM cells are added from the PD domain (orange box) periodically on the midline. The simulation recapitulates axis elongation (dashed line) and axial convergence (brackets). See also Movie S3.
(B) Elongation speed as a function of PSM cell motility and axial cell polarity in the model. Results were averaged from 10 simulation runs (4000 time-steps each) for each parameter pair.
(C) Inhibition of FGF signaling by electroporating a dominant negative FGFR1 and a GFP construct into the PSM. Bright field and GFP fluorescence images of representative embryos (ventral view) at three different time points are shown. Dashed lines contour the narrowing pNT behind the pPSM, dark strips in the fluorescent images are the NC tissue flanked by electroporated PSM cells. Scale bars: 200μm.
(D-E) Convergence of pNT after dnFGFR1 induction and after WNT5A injection, respectively. Each line represents one embryo. The width is normalized to the width at the first time point. The perturbed convergence rate was significantly lower compared to control in both cases (p<0.05, t-tests).

