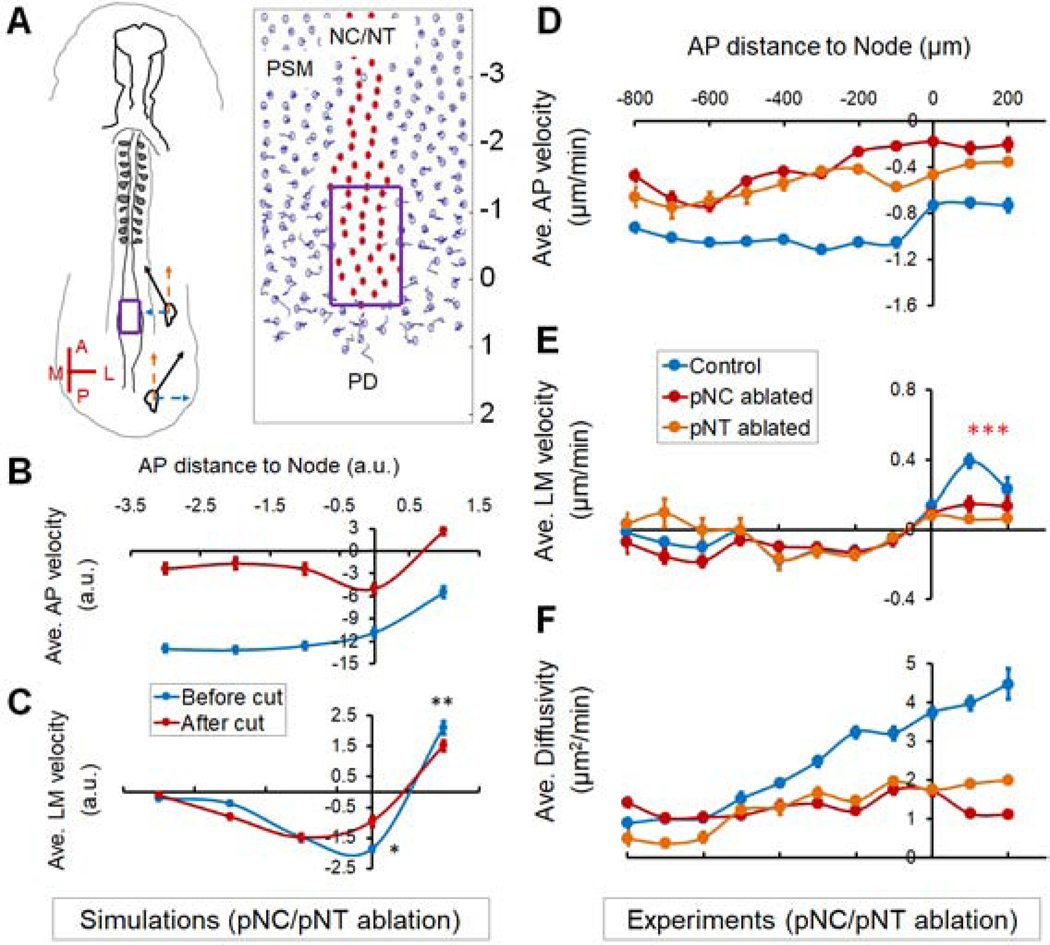
Figure 5.
Axial push is required for cell addition from the PD to the PSM
(A) Axial ablation in the embryo and the model. Purple boxes label the surgically and digitally ablated areas, respectively. The AP axis labels of the simulation field (−3 to 2) correspond to the AP distances to Node in (B) and (C). See also Movies S4.
(B) Modeled AP velocity (compare to experimental measurements in [D]), recapitulating elongation (indicated by a negative AP speed) and slow-down of elongation after axial ablation.
(C) Modeled PSM cell LM velocity (compare to experimental measurements in [E]), recapitulating convergence, midline-exit and reduction of midline-exit after axial ablation (n=40 simulations. Asterisks, p<0.05, paired t-tests).
(D-F) Average PSM cell AP (D) and LM (E) velocity and diffusivity (F) under different surgical ablations (n=3 each). Measured and plotted similarly as in Figures 1D–F. See also Movie S6.

