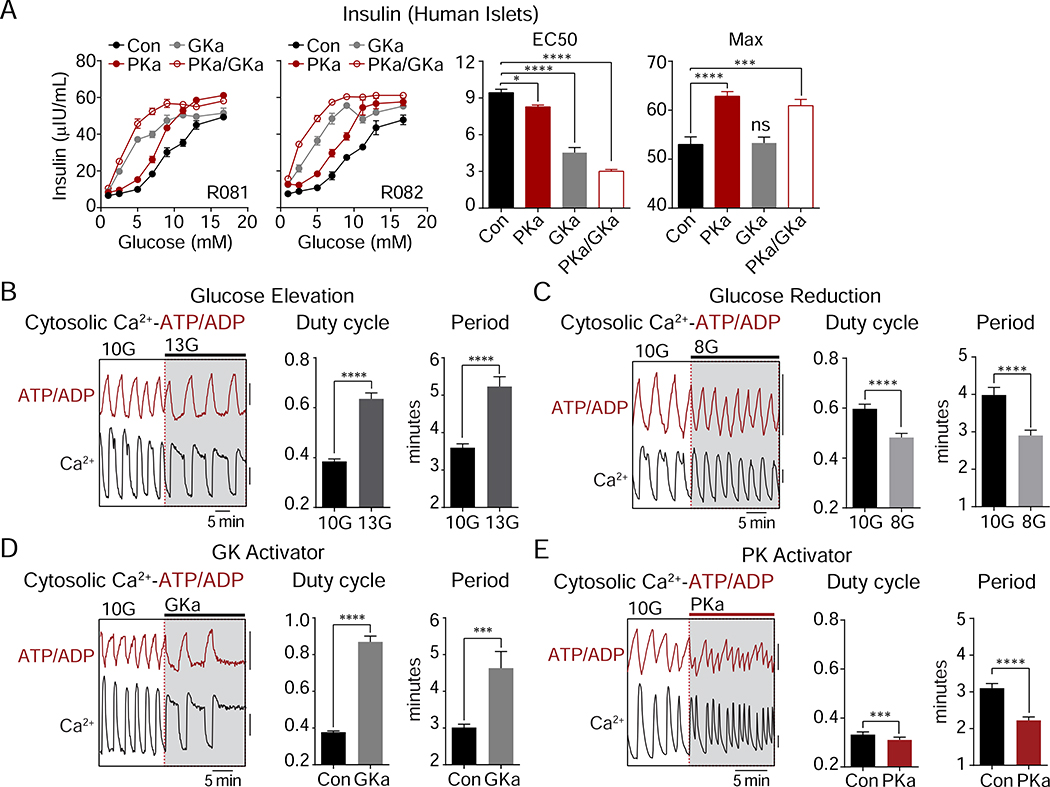
Figure 3. PK amplifies insulin secretion by a distinct mechanism from glucokinase.
(A) Glucose-dose response of insulin secretion in human islets (n = 8) in the absence or presence of GKa and PKa.
(B-E) Representative recordings and quantification of cytosolic calcium and ATP/ADP oscillations (duty cycle and period) in mouse islets. (B) Glucose elevation from 10 mM glucose (10G) to 13 mM glucose (13G) (n = 51). (C) Glucose reduction from 10G to 8 mM glucose (8G) (n = 53). (D) Addition of 500 nM GK activator (GKa) RO-0281675 in 10 mM glucose (n = 37).
(E) Addition of 10 μM PK activator TEPP-46 in 10 mM glucose (n = 62 islets from 4 mice). FuraRed (Ca2+), black scale bar = 0.01 (B, D) or 0.1 (C, E) R430/500; Perceval-HR (ATP/ADP), red scale bar = 0.01 R500/430.
Data are shown as mean ± SEM. *P < 0.05, ***P < 0.001, ****P < 0.0001 by 1-way ANOVA (A) or paired Student’s t-test (B-E). See also Table S1.

