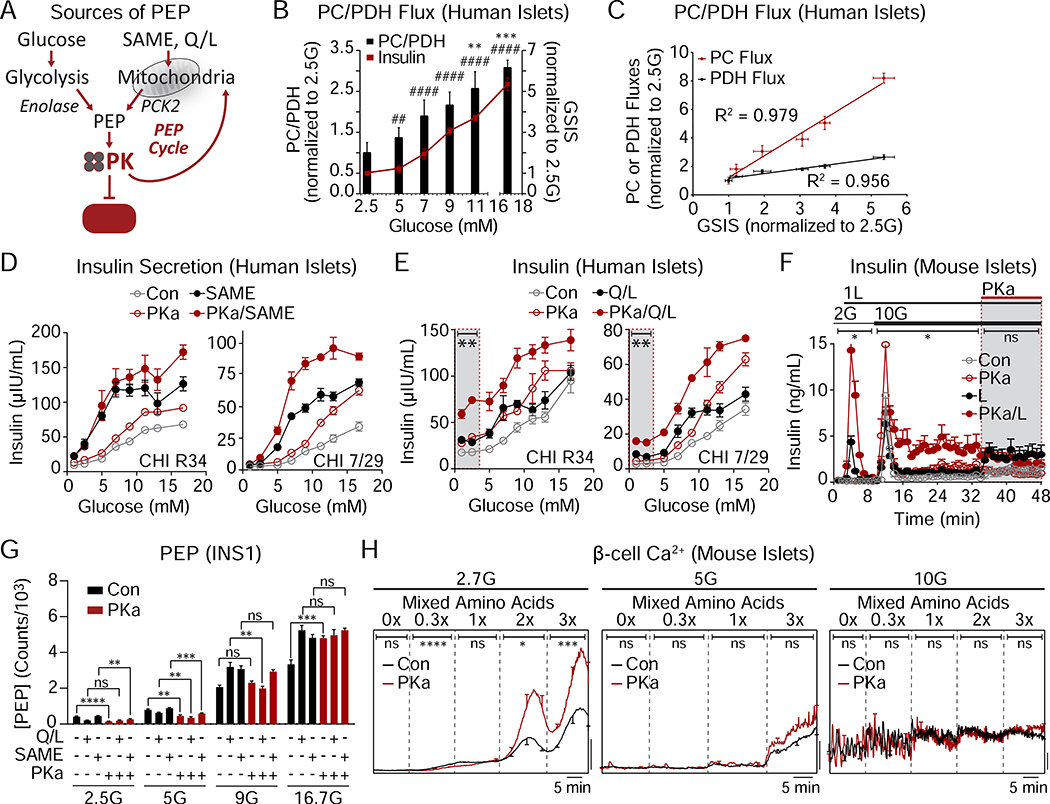
Figure 4. The GK-independent action of PK is powered by mitochondrial anaplerosis.
(A) Cartoon depicting the sources of phosphoenolpyruvate (PEP) from glycolysis and mitochondrial anaplerosis. SAME (monomethyl succinate), PCK2 (mitochondrial phosphoenolpyruvate carboxykinase), Q/L (glutamine/leucine).
(B) Flux of pyruvate carboxylase/pyruvate dehydrogenase (PC/PDH) and insulin secretion in response to various glucose concentrations (donor R082). Significance for PC/PDH is annotated with ** and significance for insulin is annotated with ##. ##P < 0.01, ####P < 0.0001.
(C) Determination of correlation of GSIS with PC and PDH fluxes (donor R082).
(D) Insulin secretion from 2 human islet donors with glucose (1–16.7 mM), 10 mM monomethyl succinate (SAME), and 10 μM PKa as indicated.
(E) Insulin secretion from 2 human islet donors with glucose (1–16.7 mM), 4 mM glutamine plus 10 mM leucine (Q/L), and 10 μM PKa as indicated.
(F) Insulin release from mouse islets in the presence of 2 and 10 mM glucose (2G, 10G), 1 mM leucine (1L), and 10 μM PKa as indicated (n = 8 mice).
(G) Concentration of PEP in INS1 832/13 cells (n = 6) in response to 2.5, 5, 9, 16.7 mM glucose (2.5G, 5G, 9G, 16.7G) in the absence or presence of 4 mM glutamine plus 10 mM leucine (Q/L), 10 mM monomethyl succinate (SAME), and 10 μM PKa.
(H) Representative average β-cell calcium in the absence or presence of PKa and in response to an amino acid ramp at 2.7 mM glucose (2.7G; left; Con, n = 19; PKa, n = 17), 5G (center; Con, n = 20; PKa, n = 19), and 10G (right; Con, n = 14; PKa, n = 13) in mouse islets.
Data are shown as mean ± SEM. *P < 0.05, **P < 0.01, ***P < 0.001, ****P < 0.0001 by 1-way ANOVA (B, D, E), 2-way ANOVA (F,H), or Student’s t-test (G). See also Tables S1–2.

