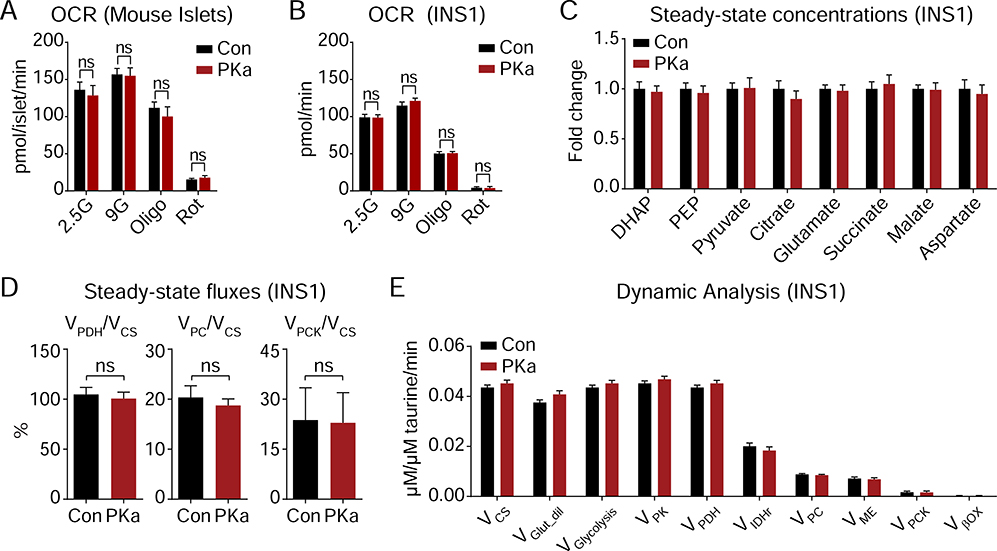
Figure 5. PK activation is independent of oxidative mitochondrial metabolism.
(A) Oxygen consumption rate of mouse islets (n = 3) treated with 10 μM PK activator TEPP-46 (PKa, n = 5) or vehicle (Con, n = 4) and the acute addition of electron transport chain inhibitors (Oligo, 1 μM oligomycin; Rot, 1 μM rotenone).
(B) Oxygen consumption rate of INS1 832/13 cells (n = 15) treated with 10 μM PK activator TEPP-46 (PKa) or vehicle (Con) and the acute addition of electron transport chain inhibitors (Oligo, 1 μM oligomycin; Rot, 1 μM rotenone).
(C-E) Impact of PK activation on INS1 832/13 metabolic fluxes. (C) Steady-state concentrations of glycolytic and TCA cycle intermediates. (D) Fractional flux through pyruvate dehydrogenase (VPDH), pyruvate carboxylase (VPC), and phosphoenolpyruvate carboxykinase (VPCK) obtained from the steady-state analysis of enrichments following incubation with [U-13C6]glucose. (E) Absolute fluxes calculated by the mathematical analysis of the time-dependent accumulation of 13C-label into the glycolytic and mitochondrial intermediates (n = 6).
Data are shown as mean ± SEM. Statistics calculated by Student’s t-test. ns, not significant.

