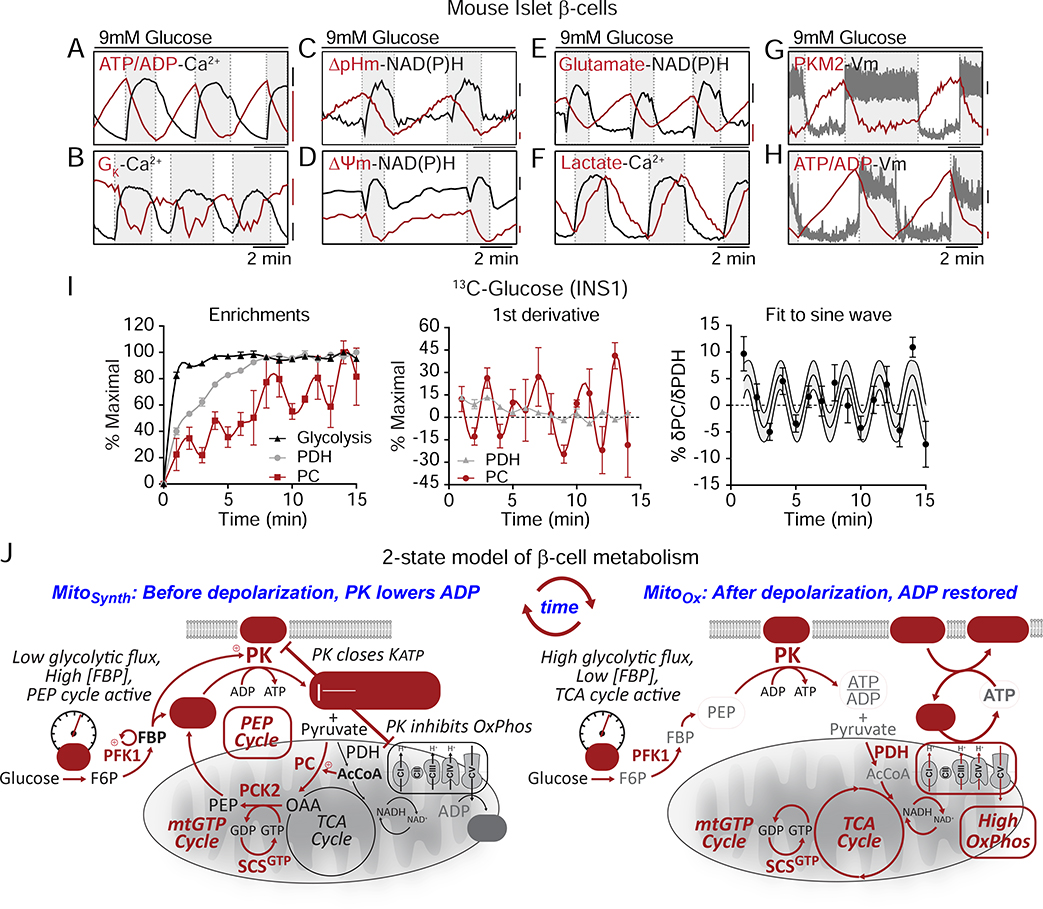
Figure 7. Evidence for a 2-state model of oscillatory β-cell metabolism.
(A-H) Metabolic and electrical oscillations in islet β-cells stimulated with 10 mM glucose. ATP/ADP, calcium, glutamate, lactate, and PKM2 are cytosolic parameters. NAD(P)H, ΔpHm (SypHer mt), and ΔΨm are mitochondrial parameters. Plasma membrane potential (Vm) and potassium conductance (GK) are electrical parameters. Silent phase, white boxes; active phase, shaded boxes.
(H) Antiphase oscillations in flux through PDH and PC in INS1 832/13 cells following the addition of 9 mM glucose.
(I) Model of oscillatory β-cell metabolism with 2 states (triggering vs. secretory) separated by membrane depolarization. Before depolarization, PK lowers ADP, reducing flux through the ETC (ADP-starved, “State 4-like”) and the TCA cycle while activating the PEP cycle. After PK lowers ADP sufficiently to close KATP channels, workload in the form of ATP hydrolysis restores ADP (e.g. by exocytosis and pumps), increasing flux through the ETC (ADP replete “State 3-like”), the TCA cycle, and glycolysis. Note that recruitable PK isoforms (M2 and L) are active before depolarization, when glycolytic flux is low and the FBP concentration is high.

