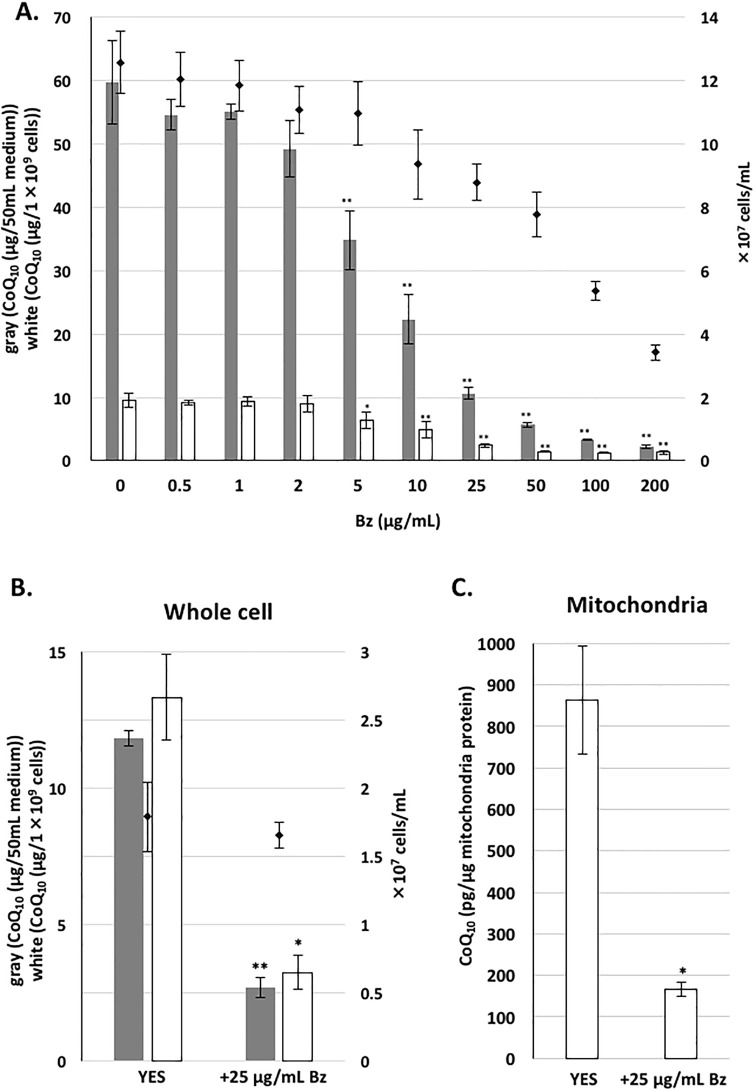
Fig 3. CoQ10 production following addition of various concentration of Bz.
WT PR110 cells were pre-cultivated in 10 mL YES medium for 1 day. Cells at ~1×10⁵ cells/mL in YES media were cultivated for two days with rotation at 30°C in the presence of the indicated amount (μg/mL) of Bz, or without Bz. Gray bars show the CoQ10 content per 50 mL of medium, and white bars show CoQ10 normalized against cell number. Diamonds show cell number. Five micrograms of CoQ6 was used as an internal standard. Data are represented as the mean ± SD of three measurements. (B) WT PR110 cells were pre-cultivated in 55 mL medium for 1 day. Yeast cells at an initial cell density of OD600 0.05 were cultivated in 1.5 L YES with 25 μg/mL of Bz, or without Bz, for 20 h with rotation at 30°C. Gray bars show the CoQ10 content per 50 mL of medium, and white bars show CoQ10 normalized against cell number. Diamonds show cell number. Five micrograms of CoQ6 was used as an internal standard. Data are represented as the mean ± SD of two measurements. (C) From isolated mitochondria, lipids were extracted with hexane:methanol:isopropanol (5:2:1) and the amount of CoQ was measured by HPLC. Two micrograms of CoQ6 was used as an internal standard for CoQ extraction. Protein concentration was measured by a Bio-Rad protein assay kit. (A−C) Asterisks on bars denote statistically significant differences (**p<0.01, *p<0.05) relative to samples from YES without Bz (Student’s t-test).

