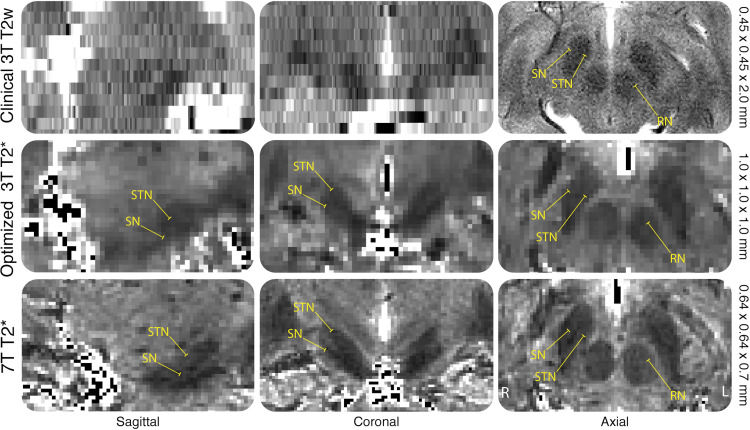
Fig 2. Voxel sizes.
Example of a single subjects clinical 3T (c3T) T2 weighted, optimized 3T (o3T) and 7T T2* maps in the coronal, sagittal and axial planes. Voxel sizes are indicated on the right side of the figure. The RN, SN and STN are highlighted to exemplify the difficulty in identification of the nuclei in the coronal and sagittal planes for the c3T compared to the o3T and 7T due to the anisotropic voxel sizes, making 3D parcellations impossible. T2 weighted images and T2* maps are presented as they show the iron rich RN, SN and STN as hypointense structures. This was done since the c3T scan did not allow for QSM calculations, which would result in a hyperintense contrast of these brain nuclei.

