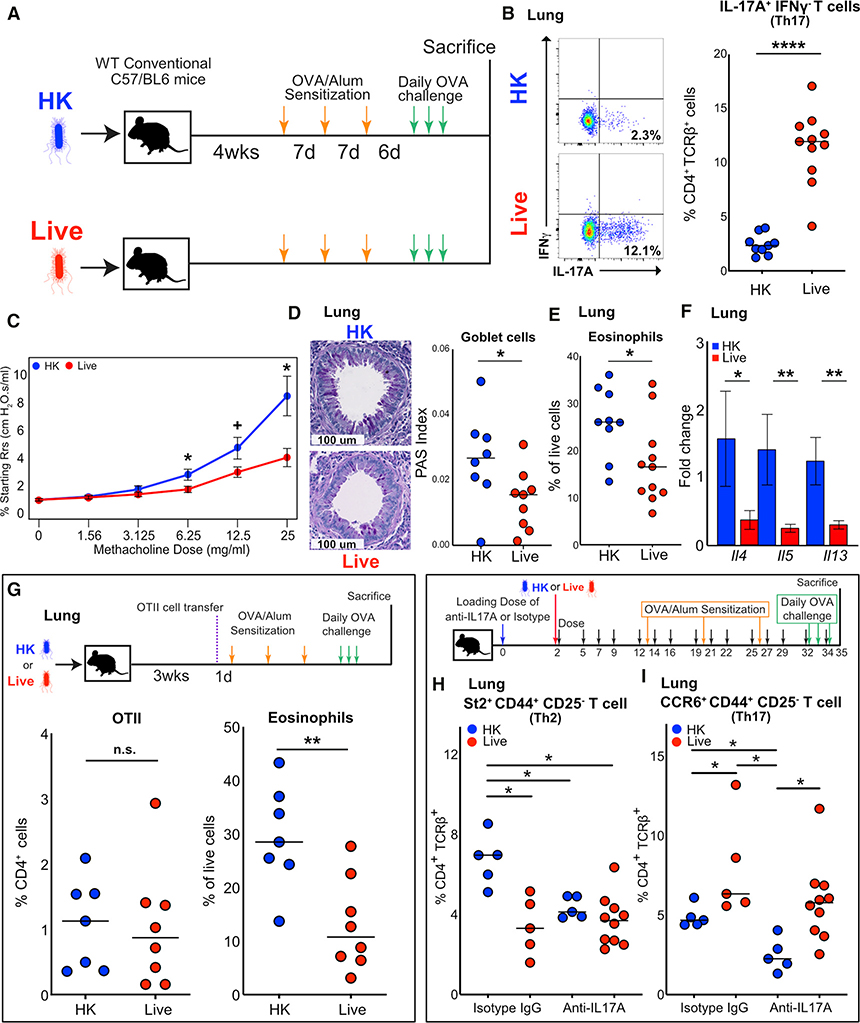
Figure 4. Bph Protects from Allergic Airway Inflammation in an Ovalbumin Model.
(A) Schematic of the model to test the role of Bph in modulating AAI. Mice were inoculated with either HK or live Bph 4 weeks before starting OSC.
(B) Quantification of flow cytometry for intracellular cytokine staining of IL-17A+IFNγ− CD4+ T cells. n = 9–11 mice/group, combined from 2 independent experiments.
(C) Measurement of airway resistance in mice undergoing methacholine challenge after inducing AAI as shown in (A). Experiments were performed using a Flexivent FX1 system. Points represent mean ± SEM, n = 8 mice/group.
(D) Left: Representative PAS staining of mouse airways in mice initially receiving either an HK or live inoculum and then undergoing OSC. Right: Quantification of PAS-positive cells normalized to total bronchial epithelial area. n = 8–9 mice/group, combined from 2 independent experiments.
(E) Eosinophils as a percentage of live cells from lung. Eosinophils were defined as Ly6G−CD11b+SiglecF+MHC II−CD11c−SSChi cells. n = 9–11 mice/group, combined from 2 independent experiments.
(F) qRT-PCR of whole-lung RNA from mice undergoing OSC. Bars represent mean ± SEM, n = 7–8 mice/group.
(G) Top: Schematic of the experiment showing that mice were either inoculated with HK or live Bph 20 days before receiving 50,000 naive OTII T cells and then undergoing OSC. Bottom: Percentage of CD4+ T cells (CD4+) expressing the OT-II receptor (CD45.1+Vα2+Vβ5+, left panel) and eosinophils as percentage of live cell (right panel) recruited to the lung. n = 7–8 mice/group, combined from 2 independent experiments.
(H) Top: Schematic of mice inoculated with HK or live Bph receiving anti-IL-17A antibody or an isotype control during colonization and then OSC. Bottom: Percentage of Th2 cells (defined as TCRβ+CD4+CD25−CD44+St2+) as a percentage of CD4+ T cells.
(I) Percentage of Th17 cells (defined as TCRβ+CD4+CD25−CD44+CCR6+) as a percentage of CD4+ T cells. n = 5–10 mice/group.
Statistical significance: Mann-Whitney U test for (B), (E), and (G). Wilcoxon rank-sum test for (C), (D), and (F). Kruskal-Wallis test followed by post hoc Wilcoxon rank-sum test with adjustment for multiple hypotheses using BH correction in (H) and (I). Horizontal lines indicate median values. + p < 0.1; *p < 0.05; **p < 0.01; ***p < 0.001; ****p < 0.0001.

