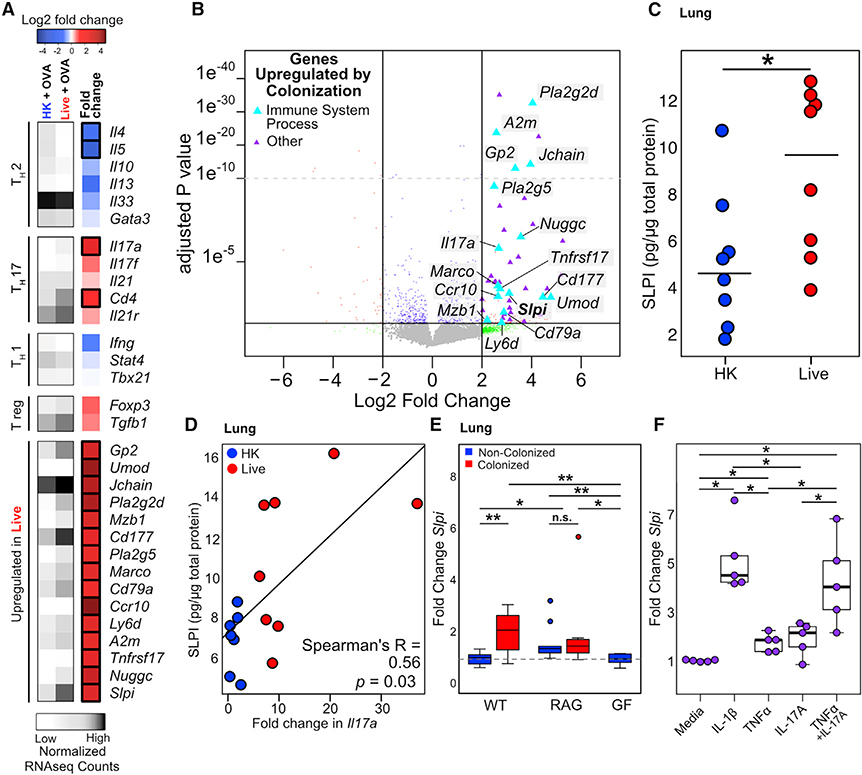
Figure 5. SLPI Is Regulated by Colonization and Mediates Protection from AAI.
(A) Heatmap of immune genes regulated by Bph colonization in mice undergoing AAI. Average normalized read counts for each group are shown in gray, and log2-fold change in mice that received a live, compared to an HK, inoculum for each gene is shown in blue, white, and red. n = 3–5 mice/group.
(B) Volcano plot of whole-lung transcriptomic data from mice that received either an HK or live Bph inoculum and then underwent OSC (as shown in Figure 4A). Genes depicted as triangles were significantly enriched in colonized mice not undergoing AAI. Genes involved in an immune system process (defined by the Gene Ontogeny [GO] pathway, GO: 0002376) are shown in light blue and are also depicted in the heatmap shown in (A). n = 3–5 mice/group.
(C) ELISA showing SLPI protein expression in the lungs of mice inoculated with live Bph followed by AAI compared to those inoculated with HK. n = 7–8 mice/group.
(D) Correlation between SLPI protein expression and fold change in Il17a measured by qRT-PCR in the lungs of mice inoculated with HK or live Bph, followed by AAI. n = 7–8 mice/group
(E) qRT-PCR of SLPI from the whole lungs from germ-free, RAG1−/−, and conventionally raised WT mice. n = 9–10 mice/group.
(F) Transcription of Slpi in human alveolar epithelial cell line A549 in response to cytokine stimulation. Cells were treated with 1 ng/ml IL-1β, 100 ng/ml IL-17A, and/or 10 ng/ml TNF-α as shown. Experiment performed in n = 5 biological replicates, each representing the average of 3 technical replicates.
Statistical significance: Wald test with BH correction as implemented in DESeq2 in (A) and (B); Wilcoxon rank-sum test for (C); Spearman’s rank test in (D); or Kruskal-Wallis test followed by post hoc two-tailed paired Wilcoxon rank-sum test with adjustment for multiple hypotheses using BH correction in (E) and (F). Boxes indicate 25th and 75th percentiles and whiskers are 1.5 × interquartile range. *p < 0.05; **p < 0.01; ***p < 0.001; ****p < 0.0001.

