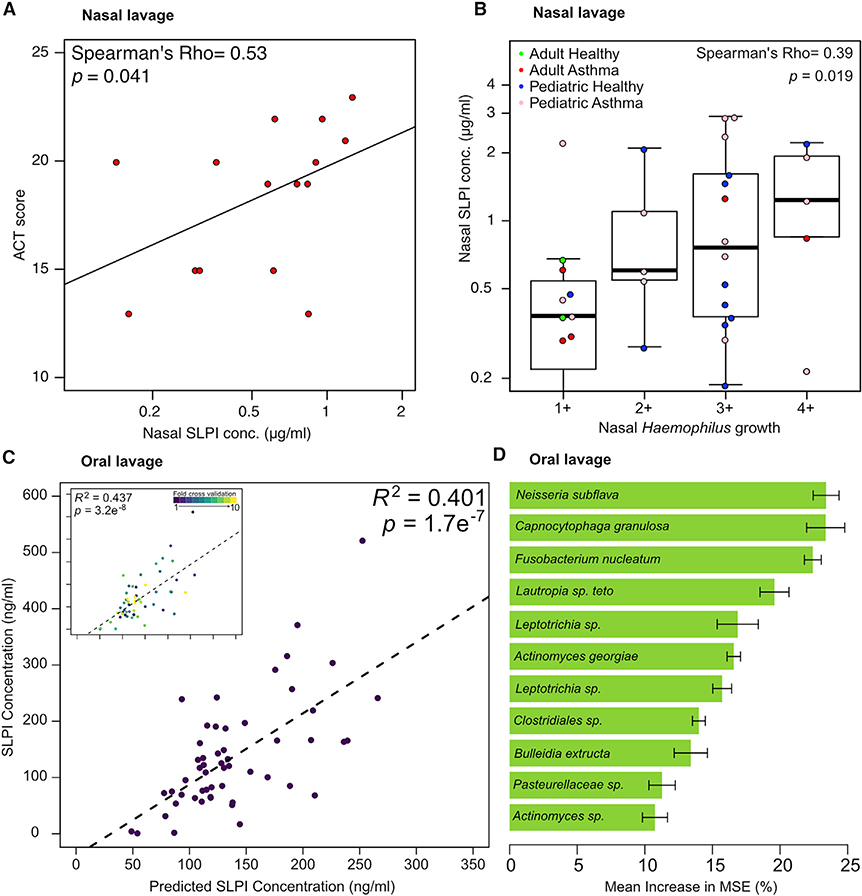
Figure 6. SLPI Levels in Human Upper Airways Are Regulated by the Microbiota.
(A) Correlation of ACT score to nasal lavage SLPI from adult asthmatics.
(B) Correlation of SLPI to recovery of Haemophilus in nasal lavage fluid. All individuals with and without asthma from both adult and pediatric cohorts that had Haemophilus colonization were included in this analysis.
(C) Oral lavage microbial community composition predicts SLPI levels. V4–16S data from healthy human children and adults were used to construct a Random Forest model to predict SLPI levels based on the abundance of 11 amplicon sequence variants (ASVs). Ten-fold cross-validation of this model performed comparably to the complete model (inset).
(D) The taxonomic assignments and mean increase in mean square error (MSE) of ASVs included in the Random Forest model depicted in (C). The mean increase in MSE is an estimate of the importance of each taxon to the Random Forest model.
Statistical significance: Spearman’s rank-order correlation for (A) and (B); or Pearson’s correlation in (C). Boxes indicate 25th and 75th percentiles and whiskers are 1.5 × interquartile range.

