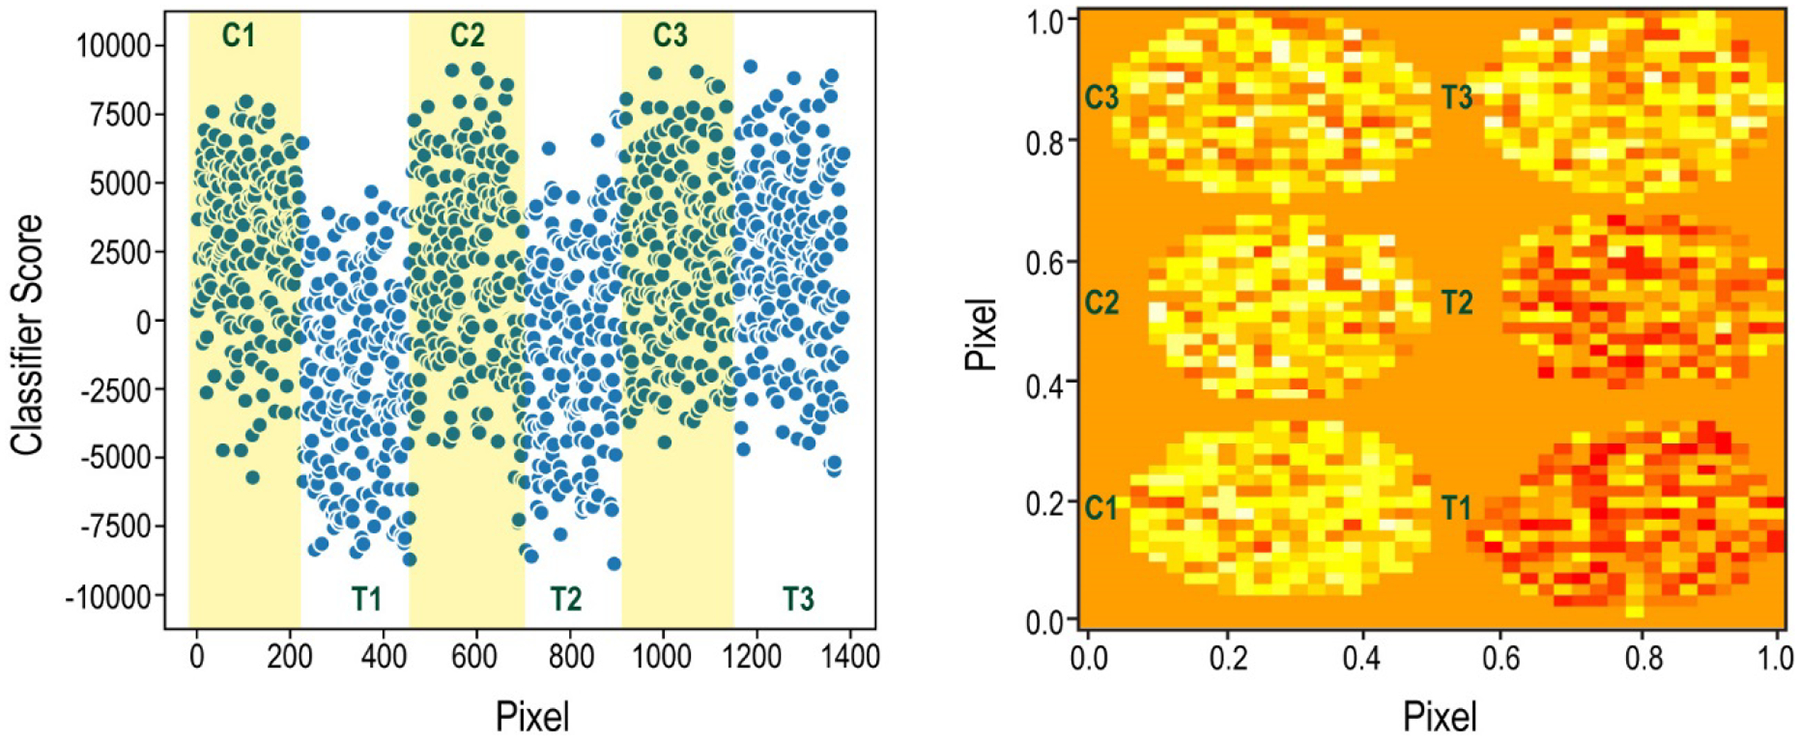
Figure 3.

Supervised classification results comparing the spheroids either treated for 24 hours with Cetuximab or their corresponding controls. Left: Raw data from the Aristotle Classifier. Each point represents the classifier score for a pixel from one of the spheroids. The classifier’s output for the pixels from the spheroid controls, C1, C2, and C3, are in the yellow shaded regions. The classifier’s output for the treated samples (T1, T2, T3) are in unshaded regions. Note: This plot (left) does not maintain the spatial arrangement of the pixels; rather, the Y dimension is Classifier Score. The X dimension, Pixel, contains the pixels from each spheroid as they were represented in the original data matrices. Right: Numeric data from the classifier imaged in the same dimensions as the original spheroids. In this plot, each pixel is represented in the orientation in which it existed on the MALDI target. Both X and Y dimensions, are “Pixel”. The color intensity correlates to the classifier score: More red is more negative, indicating the pixels classify as “treated”. More yellow is more positive, indicating the pixels classify as “control”.
