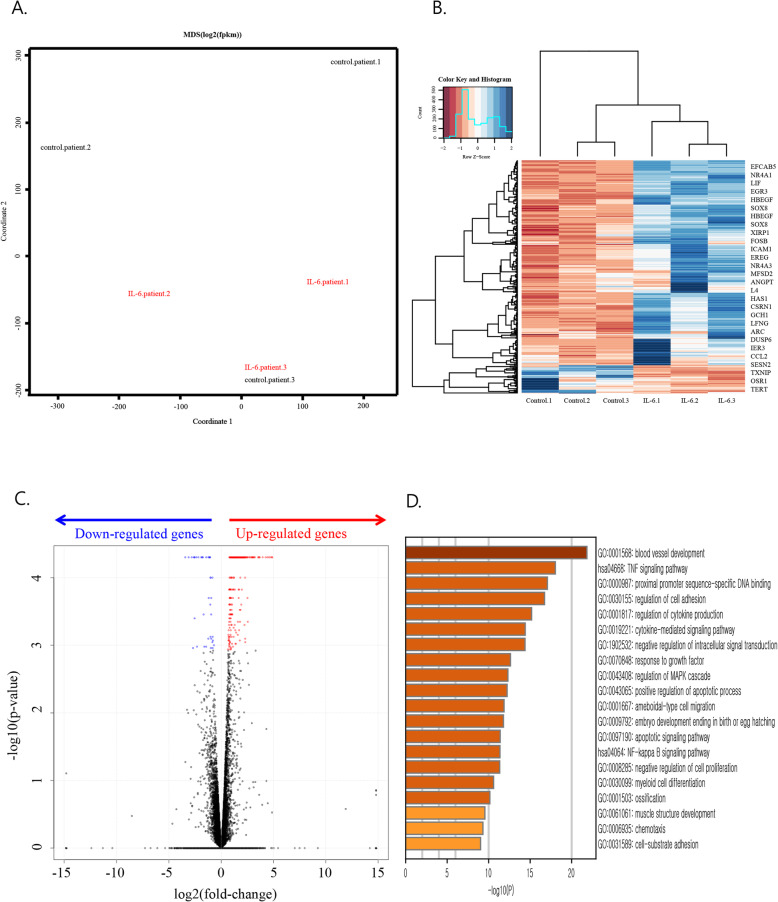
Fig. 2.
RNA sequencing of fibroblast-like synoviocytes from 3 rheumatoid arthritis patients and interleukin-6 (IL-6)-treated samples. Group 1 (control_patient 1, control_patient 2, control_patient 3), group 2 (IL-6_patient 1, IL-6_patient 2, IL-6_patient 3). a Multi-dimensional scaling (MDS) plot showing Pearson’s correlation coefficient between log2 (fragments per kilobase of exon per million fragments mapped; FPKM) of genes. b Heat map of differentially expressed genes. Gene expression expressed as FPKM. Expression normalised by z-score transformation before visualisation with heatmap. c Volcano plot of differentially expressed genes. The most upregulated genes are towards the right and the statistically significant genes are in red, the most downregulated genes are towards the left and the statistically significant genes are in blue, and the most statistically significant genes are towards the top. b, c Cutoff q-value < 0.05. d Top 20 Gene Ontology (GO) enrichment results after IL-6 treatment. Upregulated genes in 2B were subjected to GO analysis. Top 20 GO categories are shown (−log10 (P) values were calculated by Metascape software); has, Homo sapiens

