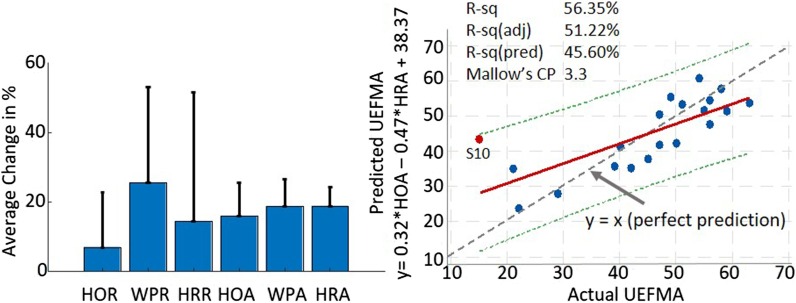
Fig. 5.
Kinematic outcomes and correlation result. Left panel shows the mean (SD) percentage changes in the range and accuracy of three movements that were used to control the games. After 3 months of intervention, Hand Open, Wrist Pitch and Roll range increased. Accuracy for each movement, which was calculated as the root mean square error, improved. Right panel illustrates the significant relationship between HOA, HOR and UEFMA. Notable is subject S10, the only outlier in this regression model, who also had the lowest baseline UEFMA score in our sample

