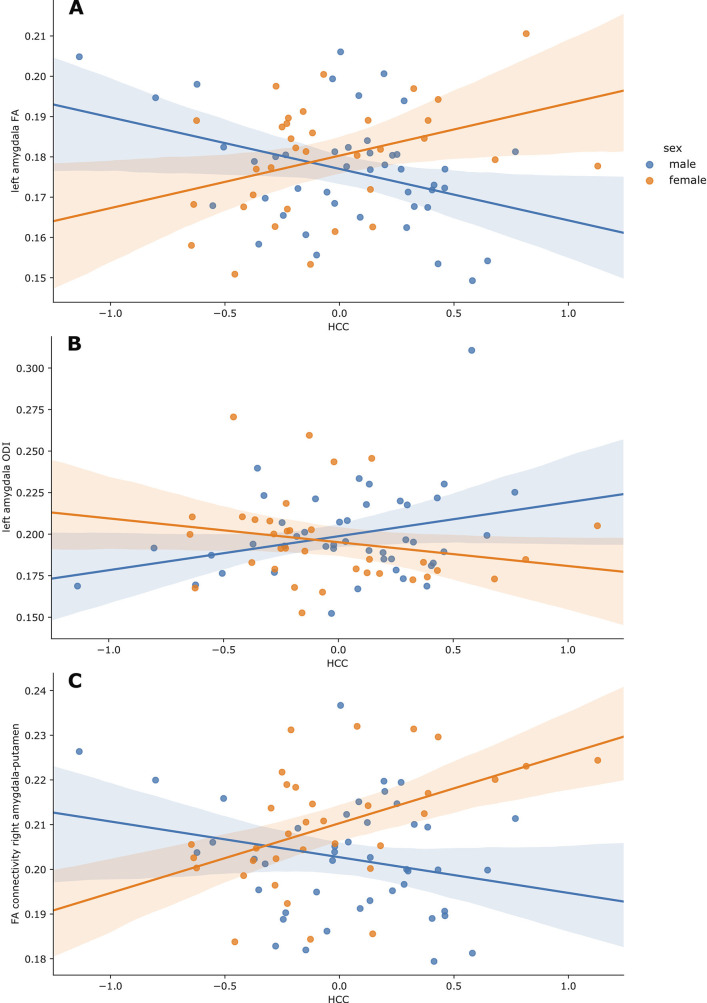
Figure 1. Partial regression plots of HCC and (A) left amygdala FA, (B) left amygdala ODI and (C) FA of connections between the right amygdala and putamen.
Plots are residualised for GA at birth, GA at scan, birthweight z-score and SIMD quintile. Boys are shown in blue, and girls in orange, along with the 95% confidence intervals.

