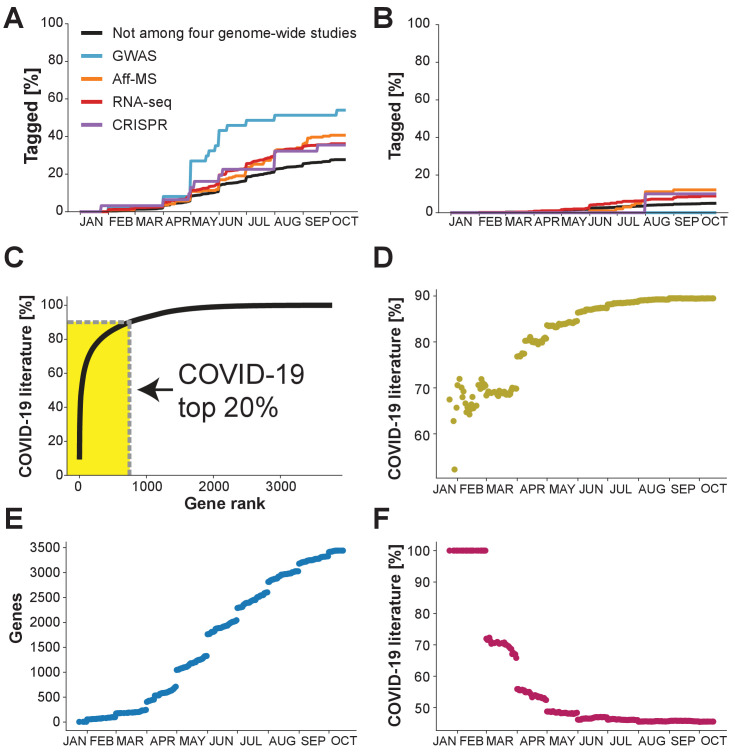
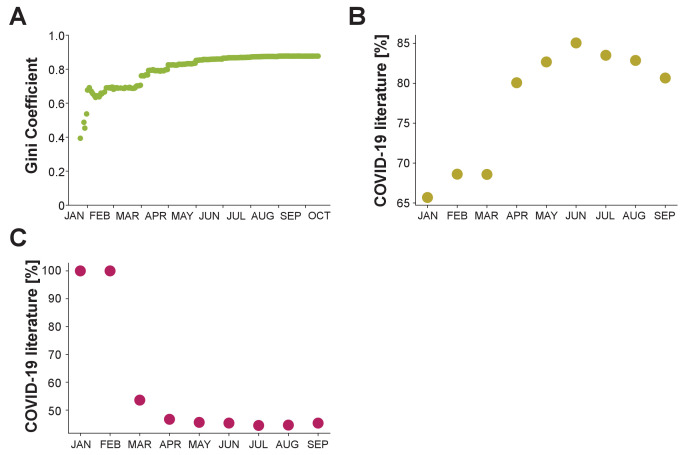
Figure 2. What the future holds?
Percentage of genes with indicated levels of support by the four genome-wide studies which have been tagged at least once in the COVID-19 literature. (A) Analysis restricted to the 50% of genes with highest number of publications in non-COVID-19 literature. (B) Analysis restricted to the 50% of genes with the lowest number of publications in the non-COVID-19 literature. (C) Cumulative share of literature on human protein-coding genes tagged in the COVID-19 literature. Top 20% indicates the 20% of genes that occur the most in the non-COVID-19 literature. Gene rank refers to the order of human protein-coding genes. The gene with the most publication equivalents would be have rank 1. Yellow area indicates share of literature accounted for by the top 20% genes. (D) Share of COVID-19 literature accounted for by the 20% of genes that had occurred the most in the COVID-19 literature by a given date. (E) Number of distinct human protein coding genes that have been tagged in the literature by a given date. (F) Share of COVID-19 literature accounted for by first 100 genes to be tagged in the COVID-19 literature by a given date.


