. 2020 Nov 13;9:e56058. doi: 10.7554/eLife.56058

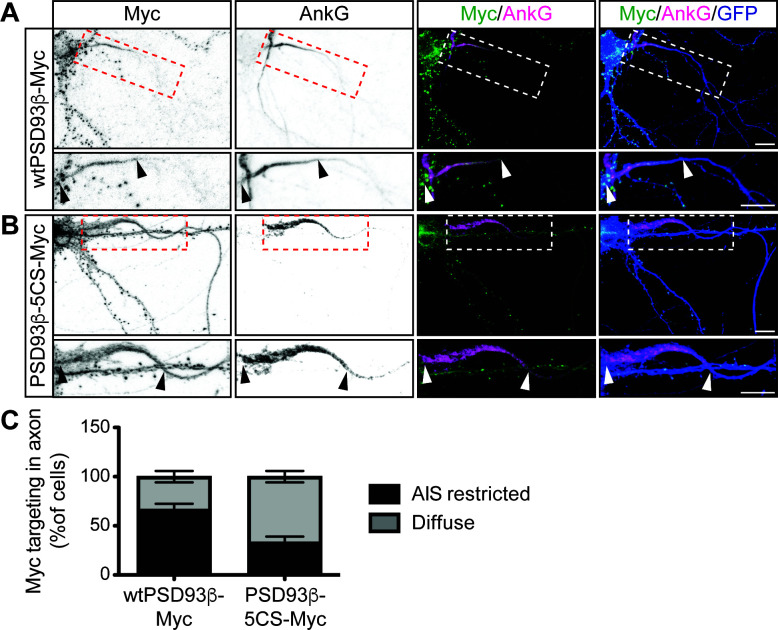
Figure 4. Contribution of direct palmitoylation to AIS targeting of PSD93β in hippocampal neurons.

Hippocampal neurons were transfected to express GFP and wtPSD93β-Myc (A) or PSD93β−5CS-Myc (B). Neurons were fixed and immunostained with antibodies against Myc (left column and green in merged images), AnkG (AIS marker, second column and magenta in merged images), and GFP (marker of infected neurons, blue in merged images, right column). Magnified views of dashed red or white boxed areas of top row images are shown below and arrowheads indicate the start and end of the AIS. Neurons were scored for Myc distribution in the axon, delineated by the presence of an AnkG-positive AIS, as diffuse axonal distribution (Diffuse) or AIS enriched/restricted distribution (AIS-enriched). (C) Quantified data for axonal images for 10 neurons per condition per experiment transfected as in A-B, from three independent cultures expressed as a percentage per culture (N = 3 independent cultures). Scale bar in full and magnified views: 10 μm.

Figure 4—source data 1. Source data for Figure 4C and for Figure 4—figure supplement 1C.

Figure 4.

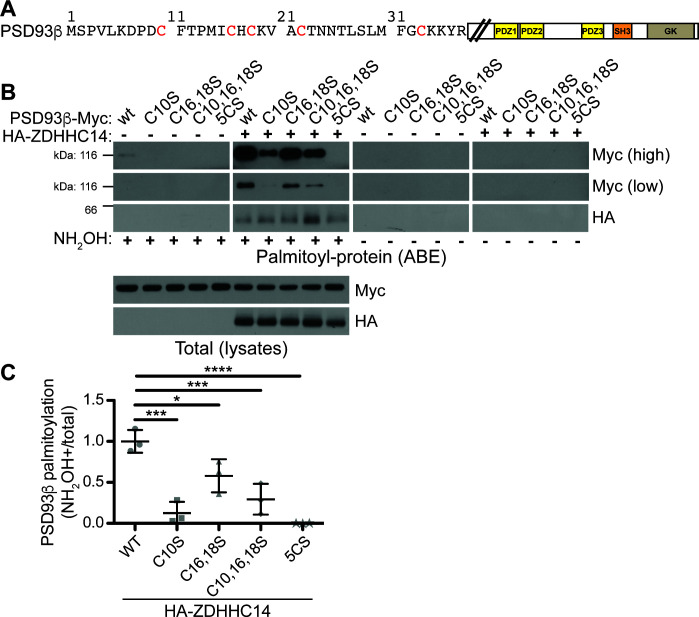
Figure 4—figure supplement 1. ZDHHC14 palmitoylates PSD93β on all five N-terminal cysteine residues.

Figure 4—figure supplement 1.

(A) Schematic of PSD93 with expanded N-terminal amino acid sequence unique to the β isoform. Cysteine residues within this N-terminal region are in red. Downstream PDZ (yellow boxes), SH3 (orange box), and guanylate kinase (GK, tan box) domains are marked (B) HEK293T cells were transfected with the indicated constructs and palmitoyl-proteins (isolated by ABE; top set of panels) were assessed by western blotting with Myc (top two panels, high and low exposures, respectively) and HA (third panel) antibodies. Bottom two panels: total protein levels in parent lysates from B, determined by western blotting with the indicated antibodies. The two left panels (all +NH2OH lanes) are a composite from the same western blot image and the two right panels (all −NH2OH lanes) are a composite from another single western blot image. (C) Quantified intensity of low exposure Myc signals from B, normalized to the wtPSD93β plus HA-ZDHHC14 condition (1-way ANOVA p<0.0001, F(4,10)=20.84, N = 3; Bonferroni post hoc test *p<0.05, ***p<0.001, ****p<0.0001, 95% CI WT versus C10S [0.52, 1.23], WT versus C16,18S [0.062, 0.78], WT versus C10,16,18S [0.35, 1.06], WT versus 5CS [0.64, 1.35]). Uncropped western blot images are in Figure 4—figure supplement 2.
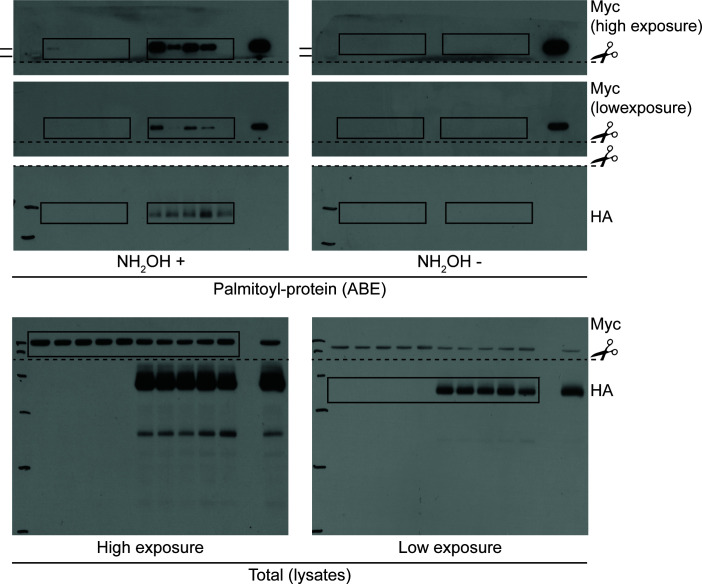
Figure 4—figure supplement 2. Uncropped western blot images for Figure 4—figure supplement 1.

Figure 4—figure supplement 2.

Bold titles indicate the figure that the uncropped images correspond to, boxes indicate cropped regions, and dashed lines and scissors indicate where membranes were cut prior to immunoblotting.