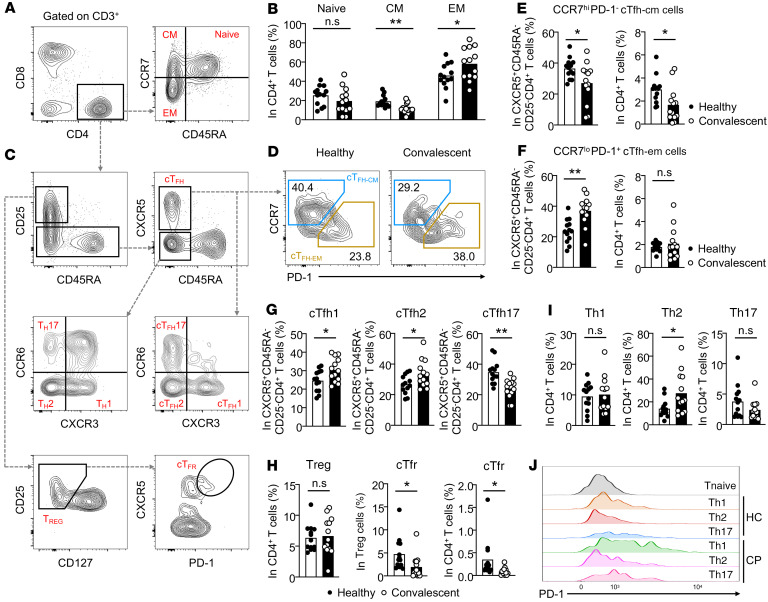
Figure 1. Peripheral CD4+ T cell subsets in COVID-19 convalescent patients.
Blood samples were collected from COVID-19 convalescent patients (n = 13) and healthy individuals (n = 13). PBMCs were isolated for antibody staining and FACs phenotyping of CD4+ T cells. (A) Gating strategies on naive CD4+ T cells (CD45RA+CCR7+), central-memory CD4+ T cells (CD45RA–CCR7+), and effector-memory CD4+ T cells (CD45RA–CCR7–). (B) Statistical analysis of the frequency of CD4+ Tnaive, CD4+ Tcm, and CD4+ Tem cells between healthy individuals and COVID-19 convalescent patients. (C) Gating strategies on different peripheral circulating CD4+ T cell subsets, including CD25–CD45RA–CXCR5+ cTfh cells, CCR7hiPD-1– central-memory cTfh (cTfh-cm) cells, CCR7loPD-1+ effector-memory cTfh (cTfh-em) cells, CXCR3+CCR6– cTfh (cTfh1) cells, CXCR3–CCR6– cTfh (cTfh2) cells, and CXCR3–CCR6+ cTfh (cTfh17) cells. Within CD3+CD8–CD4+ circulating T cells, Th1 cells were defined as CD25–CD45RA–CXCR3+CCR6– cells, Th2 cells as CD25–CD45RA–CXCR3–CCR6– cells, and Th17 cells as CD25–CD45RA–CXCR3–CCR6+ cells. Circulating Treg cells were defined as CD25+CD45RA–CD127– cells and cTfr cells as CD25+CD45RA–CD127–CXCR5hiPD-1hi cells. (D) FACs plot showing the representative cTfh-cm and cTfh-em cells between healthy individuals and COVID-19 convalescent patients. Quantifications on the frequency of these cells within cTfh cells (E) and CD4+ T cells (F). (G) Frequency of cTfh1, cTfh2, and cTfh17 cells within cTfh cells in healthy individuals and COVID-19 convalescent patients. (H) Statistical analysis showing the differences of the frequencies of Treg and cTfr cells between healthy individuals and COVID-19 convalescent patients, and the same analysis on Th1, Th2, and Th17 cells (I). (J) Histogram showing the PD-1 expression on Th1, Th2, and Th17 cells between healthy individuals and COVID-19 convalescent patients. HC, healthy control individuals (n = 13); CP, COVID-19 convalescent patients (n = 13). Each dot represents an individual subject. Bars represent the mean values. *P < 0.05 and **P < 0.01 by unpaired and 2-tailed Student’s t test.

