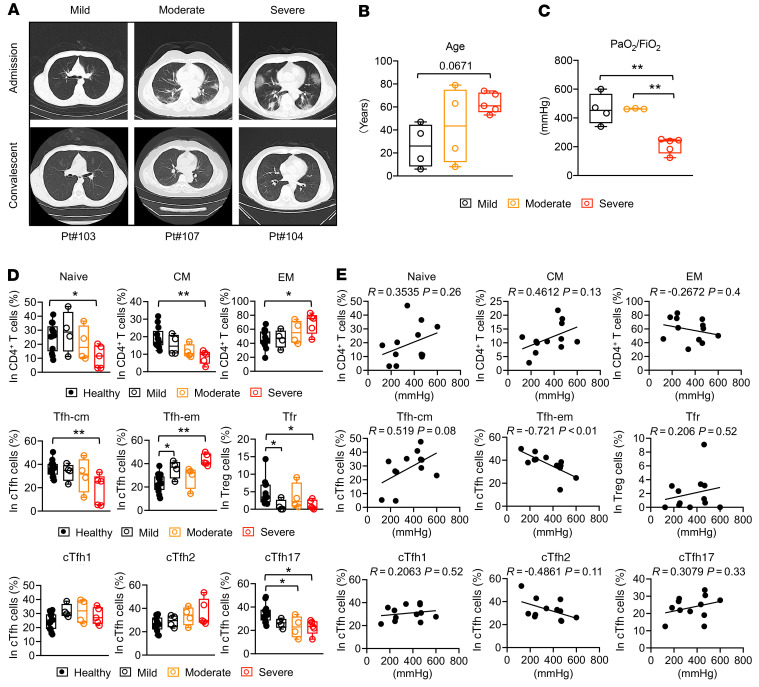
Figure 4. Peripheral CD4+ T cells in different groups of COVID-19 convalescent patients.
COVID-19 convalescent patients were categorized into mild (n = 4), moderate (n = 4), and severe (n = 5) groups based on their diagnosis certificates during admission at hospital. (A) Representative chest CT images of patients during admission and convalescence. (B) Ages of convalescent patients in different groups. (C) Blood oxygen level indicated by PaO2/FiO2 in convalescent patients of different groups. (D) Statistics showing the peripheral CD4+ T cell subsets in healthy individuals and different groups of COVID-19 convalescent patients. Healthy individuals (n = 13). (E) Correlation of peripheral CD4+ T cell subsets and PaO2/FiO2 in convalescent patients. Each dot represents an individual subject. Box plot show minimum to maximum. *P < 0.05 and **P < 0.01 by 1-way ANOVA test (B–D) or 2-tailed Pearson correlation coefficient (E). Two-tailed, nonparametric Mann-Whitney U tests were used in highly skewed distributions (D: Tnaive, Tfh-cm, Tfh-em, Tfr).

