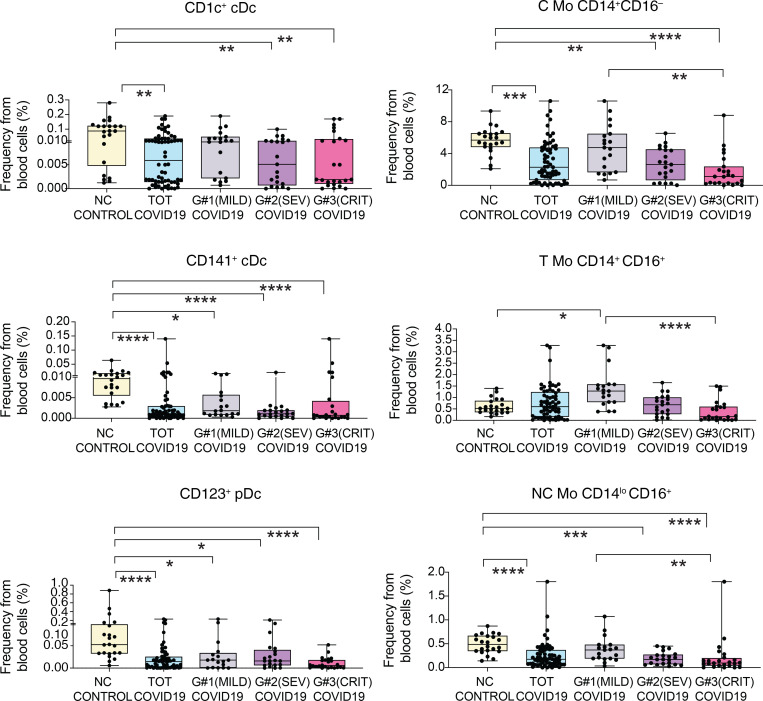
Figure 2. Analysis of different myeloid subsets in the blood of COVID-19 patients with different clinical severity.
Box-and-whisker plots representing proportions of indicated myeloid cell populations present in the blood of non–COVID-19 (n = 22) control individuals versus either total COVID-19 patients included in the study or patients stratified into groups according to mild (G1; n = 19), severe (SEV, G2; n = 21), and critical (CRIT, G3; n = 24) clinical status as shown in Supplemental Table 1. Median of values is shown. Error bars represent maximum and minimum values. Statistical significance of differences between patient groups was calculated using a Kruskal-Wallis test followed by Dunn′s post hoc test for multiple comparisons. *P < 0.05; **P < 0.01; ***P < 0.001; ****P < 0.0001.

