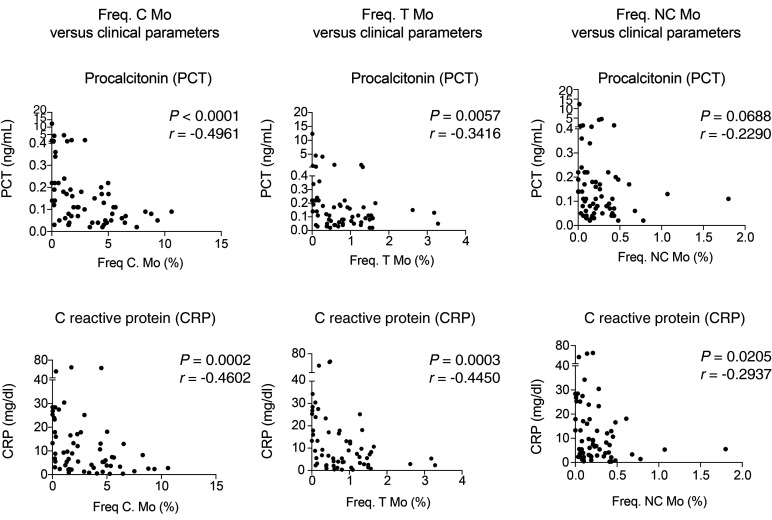
Figure 3. Analysis of associations between Mo subset frequencies and clinical parameters from COVID-19 patients.
Spearman’s correlations between frequencies of C (left), T (center), and NC (right) Mo and values of PCT (upper plots) and CRP (lower plots) detected in the blood of all COVID-19 patients included in the study. P and R values are shown in the upper right corner on each plot.

