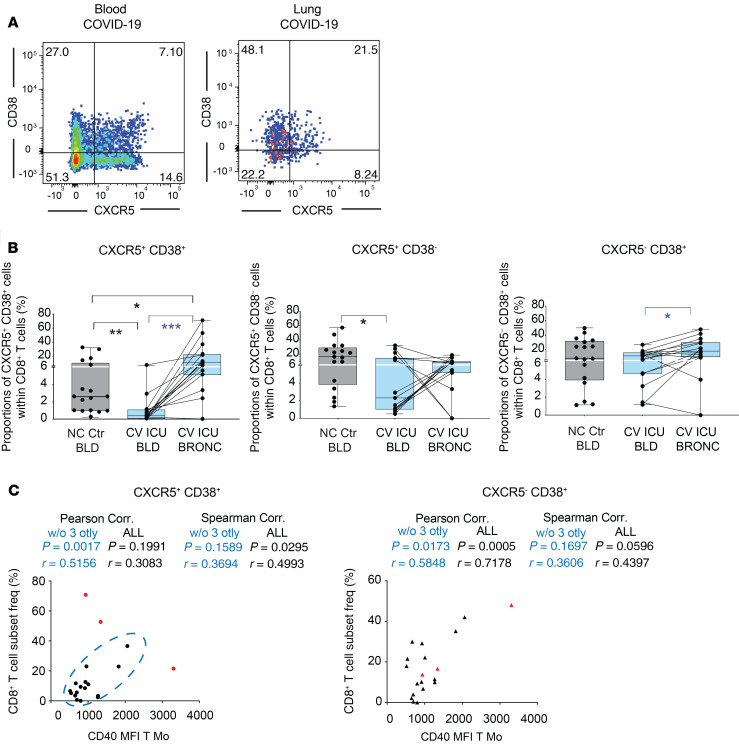
Figure 6. Association between effector CD8+ T cell and inflammatory myeloid cells present in bronchoscopy from COVID-19 patients with ARDS.
(A) Representative flow cytometry analysis of CD38 versus CXCR5 expression on gated CD8+ T cells present in the blood (left) and paired bronchoscopy infiltrate (right) from COVID-19 patients with ARDS. Numbers on quadrants represent percentages of positive cells. (B) Box-and-whiskers plots representing analysis of frequencies of CXCR5+CD38+ (left), CXCR5+CD38– (center), and CXCR5–CD38+ (right) CD8+ T cells present in paired blood and bronchoscopy samples from n = 15 COVID-19 patients presenting with ARDS. Frequencies of these CD8+ T cell subsets on the blood of n = 17 non–COVID-19 controls were included for reference. Error bars represent maximum and minimum values. Statistical significance of differences in frequencies between paired blood vs. bronchoscopy samples (blue) or comparison with healthy controls (black) was calculated using a 2-tailed matched pairs Wilcoxon’s and Mann-Whitney U test with Bonferroni’s multiple comparison correction, respectively. *P < 0.05; **P < 0.01; ***P < 0.001. (C) Spearman’s and Pearson’s correlations between proportions of the indicated effector CD8+ T cells subset and CD40 MFI on T Mo. Spearman’s and Pearson’s P and R values are shown in the upper right corner on each correlation plot.

