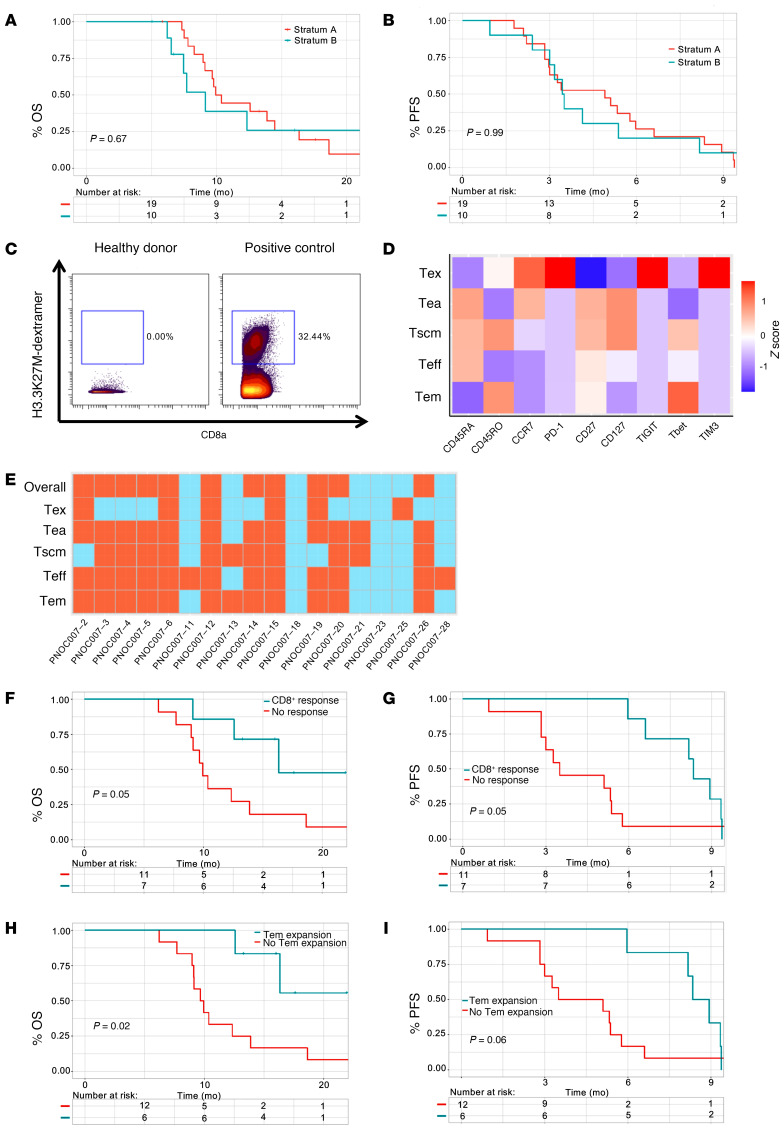
Figure 1. Mass cytometry–based phenotyping of H3.3K27M-reactive CD8+ T cell subpopulations reveals associations between immunological responses and prolonged OS or PFS.
(A and B) Kaplan-Meier survival curves contrasting the (A) OS and (B) PFS of patients enrolled in stratum A (red) and stratum B (blue) using log-rank tests. (C) Left: PBMCs derived from a healthy donor showed an absence of H3.3K27M dextramer staining. Right: The H3.3K27M dextramer exhibited sensitive detection of H3.3K27M-specific T cell receptor–transduced (TCR-transduced) CD8+ T cells. (D) Heatmap visualizing the relative expression (Z score) of subpopulation markers in patient-derived H3.3K27M-reactive CD8+ T cells. (E) Heatmap visualizing the patient-specific presence (blue) or absence (red) of an expansion of H3.3K27M-reactive CD8+ T cells in a subpopulation-specific manner. (F and G) Kaplan-Meier survival curves contrasting the (F) OS and (G) PFS of patients who had an immunological response (blue) compared with patients who did not (red) using log-rank tests. (H and I) Kaplan-Meier survival curves contrasting the (H) OS and (I) PFS of patients who had an expansion of effector memory H3.3K27M-reactive CD8+ T cells (blue) compared with patients who did not (red) using log-rank tests.

