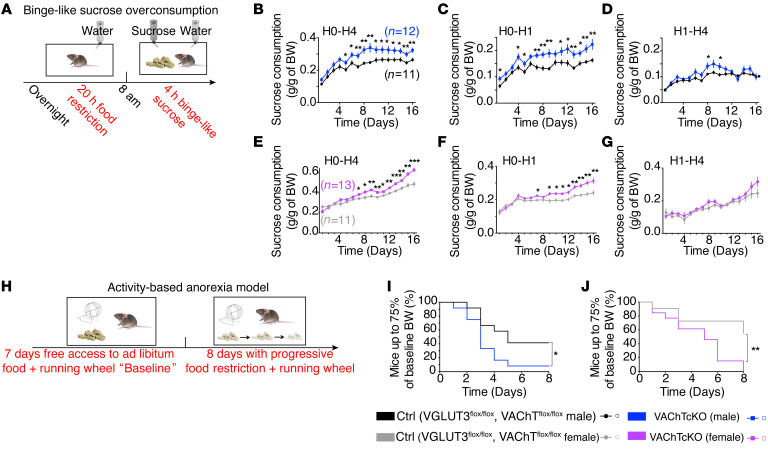
Figure 4. VAChTcKO mice develop binge- and anorexia-like phenotypes.
(A) Diagram showing the binge-like sucrose overconsumption model. Mice alternated daily between 20-hour food restriction and 4-hour simultaneous access to food and to a highly concentrated sucrose solution. (B) Daily sucrose consumption by male VAChTcKO mice (n = 12) and littermate controls (n = 12) during access to sucrose solution (H0–H4). (C) Daily sucrose consumption by male VAChTcKO mice and controls during the first hour of access to sucrose solution (H0–H1). (D) Daily sucrose consumption by male VAChTcKO mice and controls during the last 3 hours of access to sucrose solution (H1–H4). (E) Daily sucrose consumption by female VAChTcKO mice (n = 13) and littermate controls (n = 11) during access to sucrose solution (H0–H4). (F) Daily sucrose consumption by female VAChTcKO mice and littermate controls during the first hour of access to sucrose solution (H0–H1). (G) Daily sucrose consumption by female VAChTcKO mice and controls during the last 3 hours of access to sucrose solution (H1–H4). (H) Diagram of the activity-based anorexia (ABA) model. During baseline, mice were habituated to cages with running wheel for 7 days receiving ad libitum food. Then, mice underwent a progressive time-restricted access to food for 8 days. (I and J) Percentage of male (I, n = 12) and female (J, n = 12) VAChTcKO mice and controls (n = 12) that reached a critical level of less than 75% baseline BW compared with controls during ABA. Note that male and female VAChTcKO mice were significantly more affected than control mice. Two-way repeated-measures ANOVA (B–G) and post hoc comparison with the method of contrasts; Kaplan-Meier test (I and J) and post hoc comparison with log-rank Mantel-Cox and Gehan-Breslow-Wilcoxon tests. *P < 0.05, **P < 0.01, ***P < 0.001.

