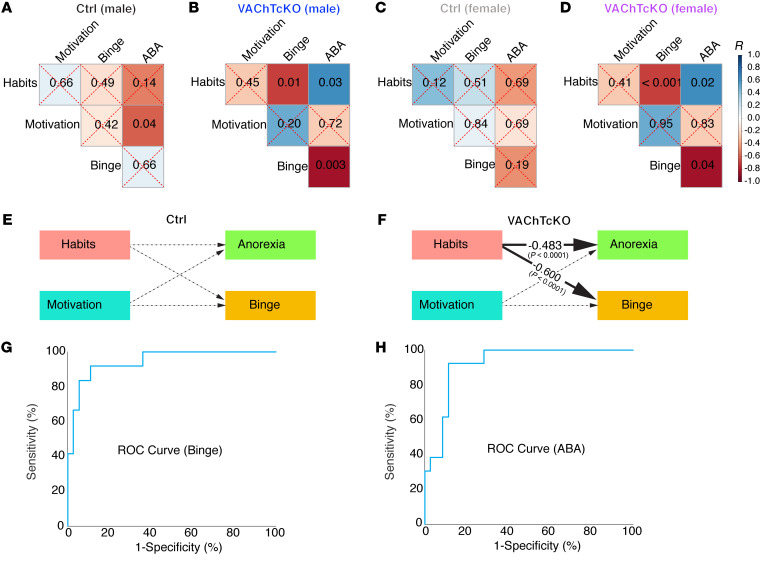
Figure 5. Propensity to habitual behavior predicts binge- and anorexia-like phenotypes in VAChTcKO mice.
(A–D) Matrices show P values of the associations between behavioral data in control (Ctrl) male mice (A), VAChTcKO male mice (B), control female mice (C), and VAChTcKO female mice (D). (E and F) Estimates of the structural equation model representing the association between habits (devaluation scores), motivation (breaking point during PR test), anorexia-like phenotype (food intake during ABA model), and binge-like phenotype (H0–H1 sucrose intake during binge-like sucrose overconsumption test) for control mice or VAChTcKO mice. These associations were adjusted by sex. Solid lines represent significant effects, whereas dashed lines represent nonsignificant ones. The effect sizes (β estimates) presented in the figure were fully standardized and therefore may be compared. Estimates were derived from a model that fit the data well (root mean square error of approximation = 0.0, standardized root mean square residual = 0.00, comparative fit index = 1.000, Akaike information criterion = 639.918, and Bayesian information criterion = 650.888) and show that habits correlate to maladaptive eating only in VAChTcKO mice. (G) ROC curves based on probabilities generated from logistic regression analyses. The logistic regression model that generated these probabilities included valuation scores, devaluation scores, motivation scores, genotype, and sex to predict binge. The logistic regression model showed 83.3% sensitivity and 94.4% specificity in predicting vulnerability to binge-like behavior. The significant predictors were the valuation scores and sex. Devaluation scores were approaching significance. The area under the ROC curve (diagnostic power) is 94.4%. (H) The logistic regression model that generated the probabilities included valuation scores, devaluation scores, motivation scores, genotype, and sex to predict anorexia. The model exhibited 76.9% sensitivity and 88.6% specificity in identifying vulnerability to anorexia-like behavior. The only significant predictor was the devaluation scores. The area under the ROC curve (diagnostic power) is 92.1%.

