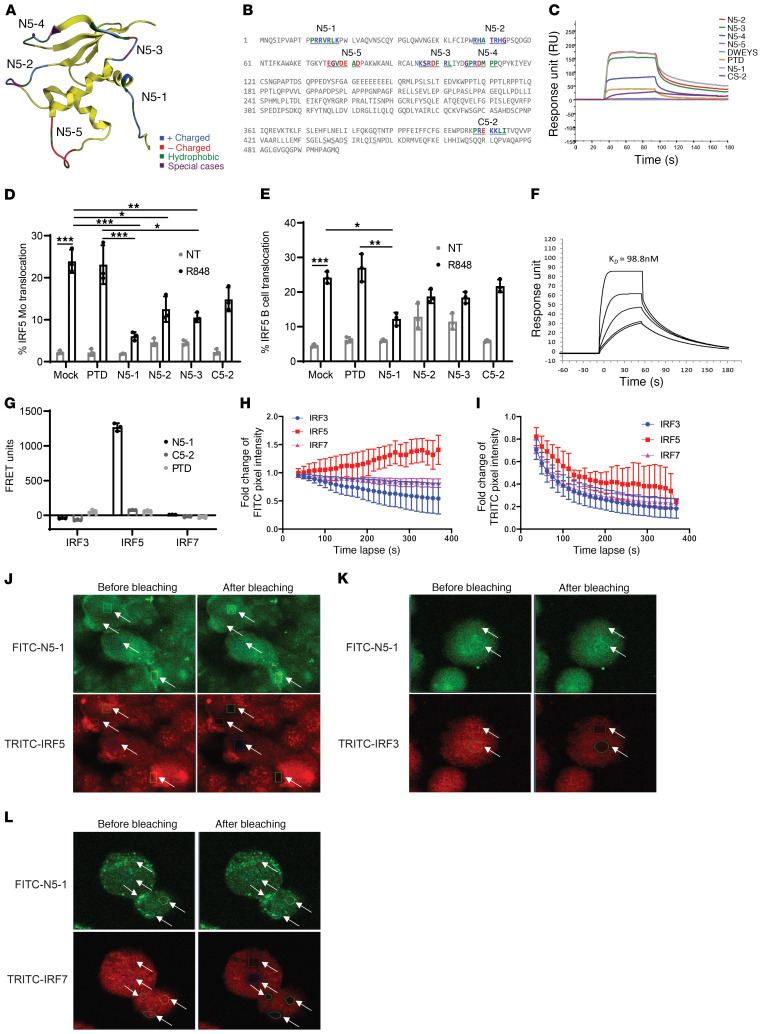
Figure 2. Design of IRF5 peptide mimetics.
(A) Homology model of the IRF5 DBD with location of N-terminal peptides and amino acid characteristics. (B) Position of N- and C-terminal peptides highlighted within the full-length IRF5 V5 sequence. The color code is based on the amino acid characteristics defined in A. (C) Biacore T200 SPR analysis of peptide mimetics. Data are representative of 4 independent experimental replicates per peptide. (D and E) IRF5 nuclear translocation quantified in healthy donor PBMCs preincubated with 10 μM peptide for 1 hour and stimulated with 500 ng/mL R848 for 2 hours using imaging flow cytometry. Plots show quantification in CD45+CD14+ monocytes (D) and CD45+CD19+ B cells (E). n = 3 independent samples from healthy donors. (F) Kinetics analysis of N5-1 peptide binding to IRF5 by SPR. Data are representative of 4 independent experimental replicates. (G) Purified human monocytes were preincubated with 2.5 μM FITC-PTD, –N5-1, or –C5-2 for 1 hour followed by permeabilization and staining for intracellular IRF3, IRF5, or IRF7 with TRITC-conjugated antibodies. FRET units were calculated from fluorescence emissions (see Supplemental Methods). n = 3 independent samples from healthy donors. (H–L) In vivo monitoring of the interaction between FITC–N5-1 and endogenous IRF3, IRF5, or IRF7 in THP1 cells by acceptor photobleaching FRET microscopy. (H and I) Fold change in donor pixel intensity was monitored in the photobleached regions (J–L) and plotted over time. Photobleached regions are indicated by white arrows. Images were acquired before and after acceptor photobleaching. Representative images of FITC–N5-1 and TRITC-IRF5 (J), TRITC-IRF3 (K), and TRITC-IRF7 (L) are shown (original magnification, ×60). Data are representative of 3 independent biological replicate experiments performed in triplicate. Data represent the mean ± SD. *P ≤ 0.05, **P ≤ 0.01, and ***P ≤ 0.001, by 1-way ANOVA.

