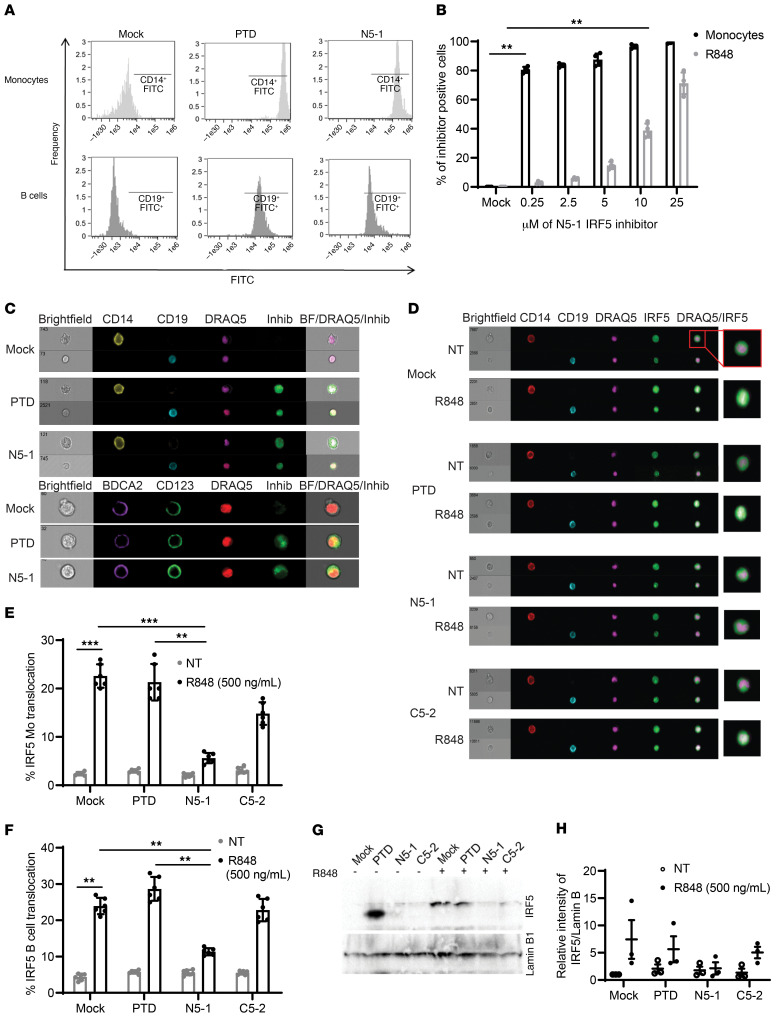
Figure 4. IRF5 peptide inhibitors readily enter primary immune cells to inhibit R848-induced IRF5 nuclear translocation.
(A) Representative flow cytometry histograms showing uptake of 10 μM FITC-conjugated PTD or N5-1 after incubation of human PBMCs with an inhibitor for 1 hour. For inhibitor uptake, an FITC intensity of greater than 104 in CD14+ monocytes (light gray) and 103 in CD19+ B cells (dark gray) was considered positive. (B) Percentage of total monocytes and B cells positive for FITC-conjugated N5-1. n = 4 independent samples from healthy donors. (C) Representative images of cellular uptake of 10 μM FITC-conjugated PTD or N5-1 in monocytes (top row), B cells (bottom row), and pDCs (bottom panel). Inhib, inhibitor. (D) Representative images of IRF5 cellular localization in monocytes (CD14) and B cells (CD19) after preincubation of PBMCs with 10 μM mock, PTD, N5-1, or C5-2 inhibitors followed by stimulation with 500 ng/mL R848 for 2 hours. (E and F) Quantification of IRF5 nuclear translocation in monocytes (E) and B cells (F) was done by imaging flow cytometry. n = 6 independent samples from healthy donors. (G) Representative Western blot of nuclear extracts from primary human monocytes following treatment with 2.5 μM mock, PTD, N5-1, or C5-2 inhibitors and stimulation with 500 ng/mL R848 for 2 hours. (H) Quantification of nuclear IRF5 from G relative to lamin B1. n = 3 independent samples from healthy donors. Data are representative of 3 or more independent experimental replicates. Data represent the meant ± SEM. **P ≤ 0.01 and ***P ≤ 0.001, by 1-way ANOVA.

