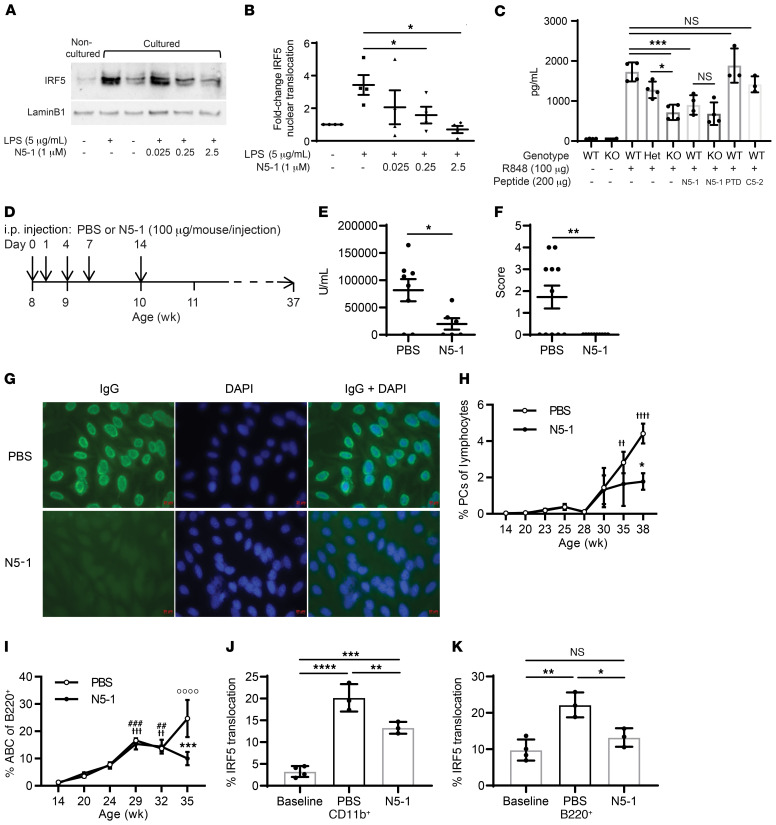
Figure 5. N5-1 protects NZB/W mice from spontaneous onset of lupus.
(A) Representative Western blot of nuclear extracts from RAW264.7 macrophages pretreated for 1 hour with N5-1 followed by LPS for 2 hours. Noncultured cells, 0 hours before pretreatment; cultured cells, 3 hours after treatment. (B) Quantification of nuclear IRF5 in A relative to lamin B1 from 3 independent replicates. Statistical significance was determined by 1-way ANOVA. (C) In vivo inhibition of IL-6 secretion by N5-1 in WT (Irf5+/+), heterozygous (Het) (Irf5+/–), and KO (Irf5–/–) mice. Sera were harvested 1.5 hours after R848 administration. n = 3–4 mice/group. Statistical significance was determined by 1-way ANOVA. (D) N5-1 dosing strategy for NZB/W F1 mice. (E) Anti-dsDNA Ig titers (1:500 serum dilution) in mice at 20 weeks of age. (F) ANA immunofluorescence scoring for sera from 11 PBS- and 10 N5-1–treated mice. 0, negative signal; 4, strongest signal. Statistical significance was determined by Mann-Whitney U test. (G) Representative ANA images from 27-week-old treated mice (×20 objective and ×10 eyepiece). (H and I) Percentage of circulating IgD–B220CD138+ PCs (H) and B220+CD11c+CD11b+ ABCs (I). n = 4 mice/time point. Statistical significance was determined by 2-way ANOVA and Bonferroni’s multiple-comparison test. (H) F(7,35) = 10.27, P < 0.0001, age; F(1,35) = 4.125, P = 0.049, treatment; F(7,35) = 1.627, P = 0.1603, interaction. *P = 0.0133 vs. PBS, week 38; ††P < 0.0081 and ††††P < 0.0001 vs. PBS, week 14. (I) F(5,32) = 20.63, P < 0.0001, age; F(1,32) = 4.402, P = 0.0439, treatment; F(5,32) = 4.146, P = 0.0051, interaction. ***P = 0.0001 versus PBS, week 35; ††P = 0.0033, †††P = 0.0002 and ††††P < 0.0001 vs. PBS, week 14; ##P = 0.0005 and ###P = 0.0029 vs. N5-1, week 14. (J and K) Inhibition by N5-1 of IRF5 activation in cohort 2 (14–21 weeks old). CD11b+ monocytes (J) and B220+ (K) B cells. n = 4 mice/group. Statistical significance was determined by 1-way ANOVA. Data represent the mean ± SEM. *P ≤ 0.05, **P ≤ 0.01, ***P ≤ 0.001, and ****P ≤ 0.0001.

