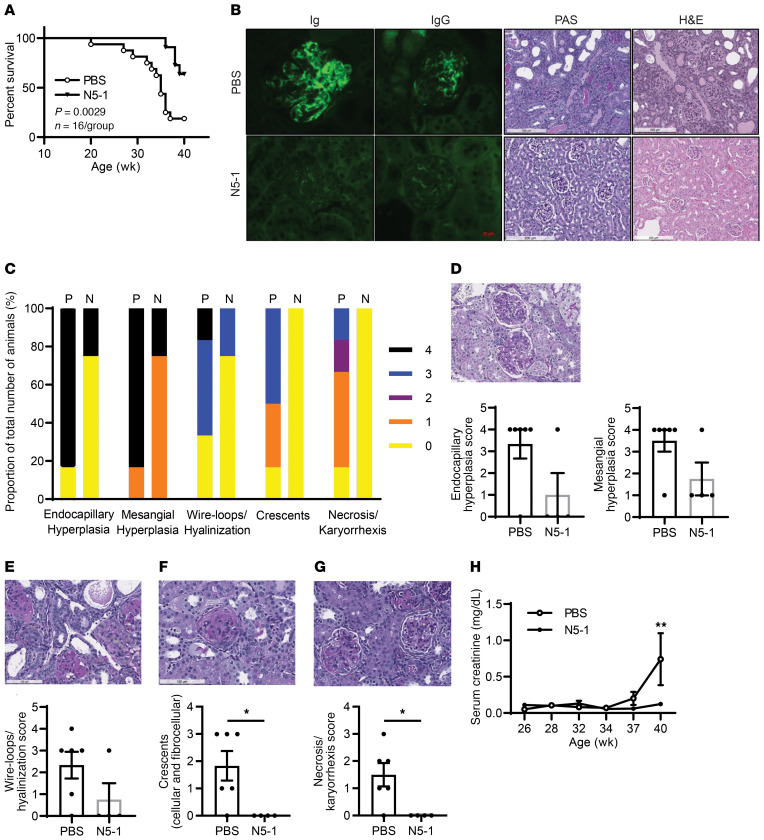
Figure 6. N5-1 reduces kidney pathology and increases overall survival.
(A) Kaplan-Meier survival curves. Differences were determined by Gehan-Breslow-Wilcoxon test. n = 11 mice/group. (B) Representative microscopic images of kidney sections; fluorescence deposition of Ig and IgG (×40 magnification), periodic acid–Schiff (PAS) staining, and H&E staining (×10 magnification). (C) Summarized scoring of renal inflammation and damage shown in D–G from 6 PBS-treated mice and 4 N5-1–treated mice. (D–G) Microscopic images of kidney sections assessed by PAS staining (original magnification, ×20) showing images of endocapillary and mesangial hyperplasia (D), wire-loops/hyalinization (E), crescents (F), and necrosis/karyorrhexis (G). Scoring for 100 glomeruli per case is shown. (H) Serum creatinine levels were plotted over the course of the disease. n = 8 mice/group. *P ≤ 0.05, by Mann-Whitney U test.

