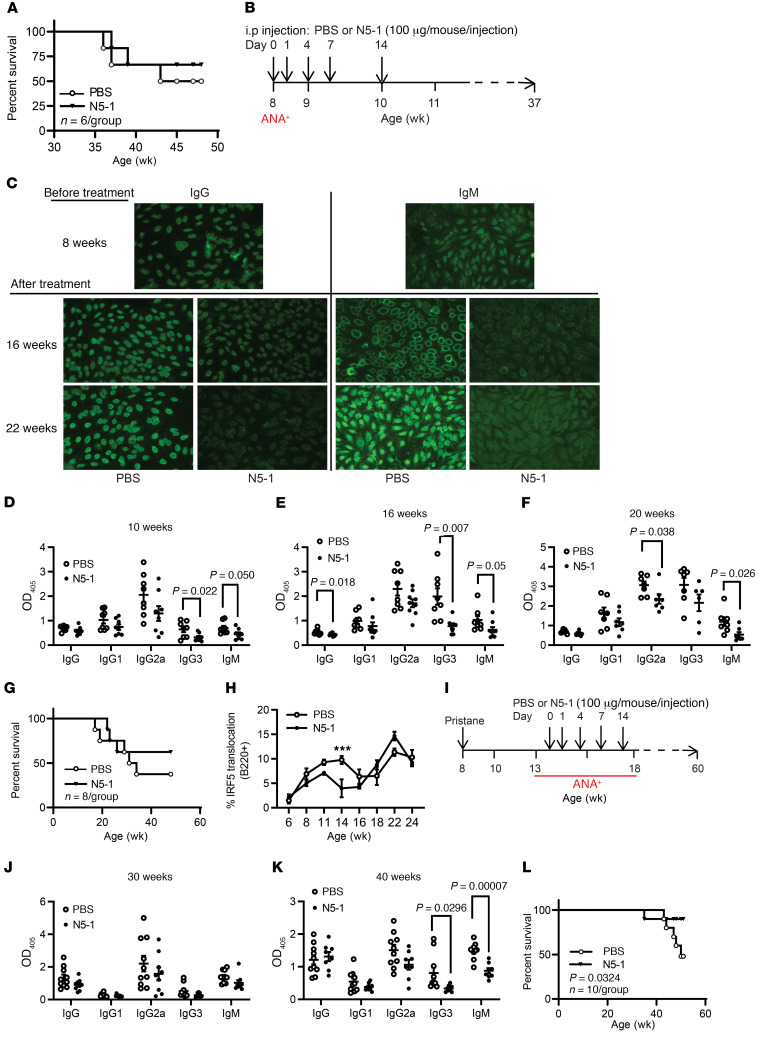
Figure 7. Therapeutic efficacy of N5-1 in ANA-positive NZB/W F1, MRL/lpr, and pristane-induced lupus mice.
(A) Kaplan-Meier survival curves of NZB/W F1 mice treated at 27 weeks of age. Differences were determined by Gehan-Breslow-Wilcoxon test. n = 6 mice/group. (B) N5-1 dosing strategy for MRL/lpr mice. (C) Representative ANA images from 8-week-old pretreated mice and 16- and 22-week-old treated mice (×20 objective and ×10 eyepiece). (D–F) Anti–dsDNA IgG isotype titers (1:500 serum dilution) were measured at 10, 16, and 20 weeks of age. (G) Kaplan-Meier survival curves of treated MRL/lpr mice. Differences determined by Gehan-Breslow-Wilcoxon test. n = 8 mice/group. (H) Analysis of IRF5 nuclear translocation in B220+ B cells from PBS- and N5-1–treated MRL/lpr mice. n = 8 mice/group. (I) N5-1 dosing strategy for pristane-injected mice. (J and K) Anti–dsDNA IgG isotype titers (1:500 serum dilution) were determined at 30 (J) and 40 (K) weeks of age. (L) Kaplan-Meier survival curves of pristane-induced BALB/c mice. Differences were determined by Gehan-Breslow-Wilcoxon test. n = 10 mice/group. (D–F, H, J, and K) ***P ≤ 0.0001, by Mann-Whitney U test.

