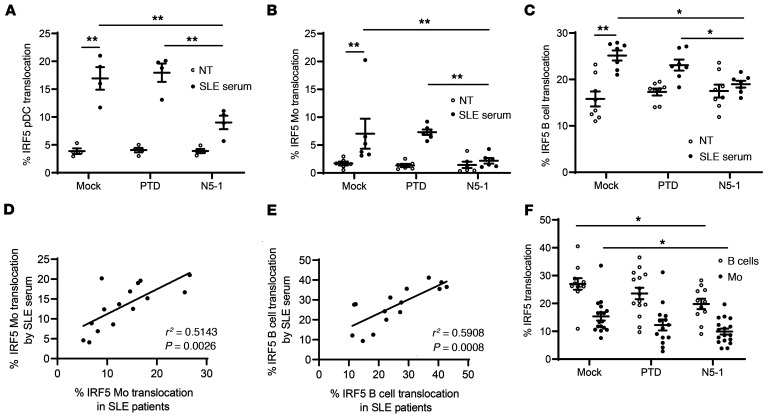
Figure 8. N5-1 inhibits SLE serum–induced IRF5 activation and reverses IRF5 hyperactivation in SLE immune cells.
(A) Healthy donor PBMCs (n = 6) were preincubated with an inhibitor (10 μM) followed by stimulation with 2% SLE serum for 2 hours. The percentage of IRF5 nuclear translocation is shown in pDCs (A), monocytes (B), and B cells (C) from imaging flow cytometry. (D and E) Correlation between the percentage of IRF5 translocation in SLE serum–stimulated monocytes (D) or B cells (E) and in vivo IRF5 activation in matched SLE monocytes or B cells, respectively, by linear regression analysis. (F) SLE PBMCs were mock or inhibitor treated (10 μM) for 1 hour, and IRF5 activation in monocytes and B cells was quantified by imaging flow cytometry. The percentage of IRF5 nuclear translocation is shown. Data represent the mean ± SEM. Differences between groups were determined by 2-way ANOVA with Bonferroni’s multiple-comparison test. *P ≤ 0.05 and **P ≤ 0.01.

