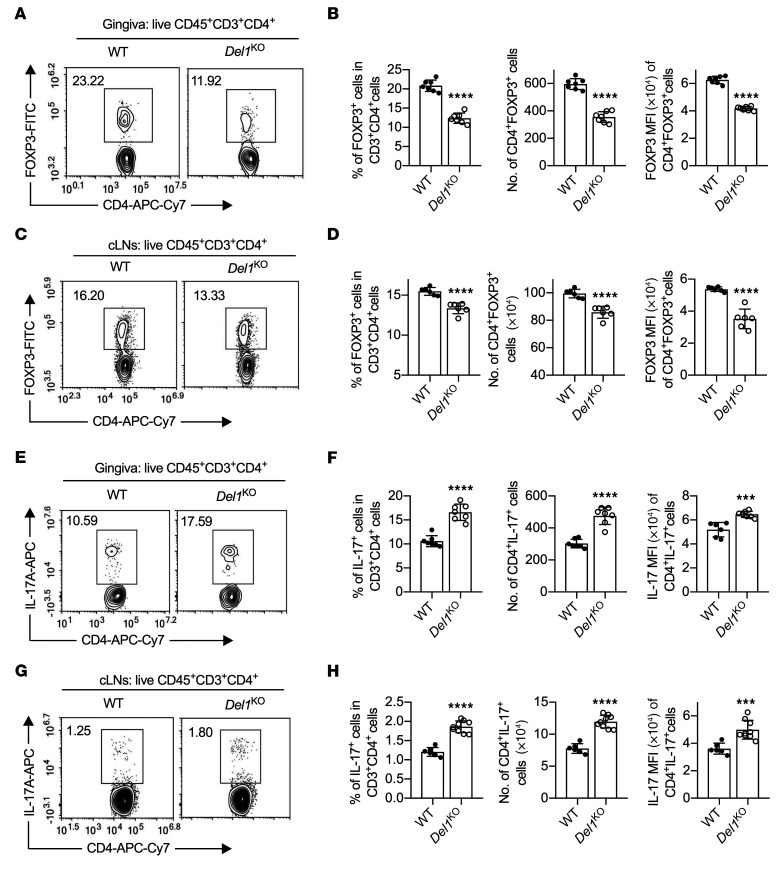
Figure 1. DEL-1 deficiency decreases Treg numbers while it increases Th17 cells during resolution of inflammation.
Groups of littermate WT and Del1KO mice were subjected to ligature-induced periodontitis (LIP) for 10 days and ligatures were removed on day 10 (to facilitate inflammation resolution) for 5 days. (A–D) FACS plots of Tregs in gingival tissues (A) and cLNs (C) on day 15 and bar graphs showing percentage of Tregs in CD4+ T cells (left), absolute numbers (middle), and FOXP3 MFI (right) of Tregs from gingival tissues (B) and cLNs (D) of littermate WT and Del1KO mice on day 15 (n = 6–7 mice/group). (E) FACS plots of Th17 cells in gingival tissue on day 15 and (F) bar graphs showing percentage of Th17 cells in CD4+ T cells (left), absolute numbers (middle), and IL-17A MFI of Th17 cells (right) from gingival tissues of littermate WT and Del1KO mice on day 15 (n = 7 mice/group). (G) FACS plot of Th17 cells in cLNs and (H) bar graphs showing percentage of Th17 cells in CD4+ T cells (left), absolute numbers (middle), and IL-17A MFI of Th17 cells (right) from cLNs of littermate WT and Del1KO mice on day 15 (n = 6 mice for WT group and n = 9 for Del1KO group). Data are means ± SD and are pooled from 2 independent experiments. ***P < 0.001, ****P < 0.0001 vs. WT mice by 2-tailed Student’s t test.

