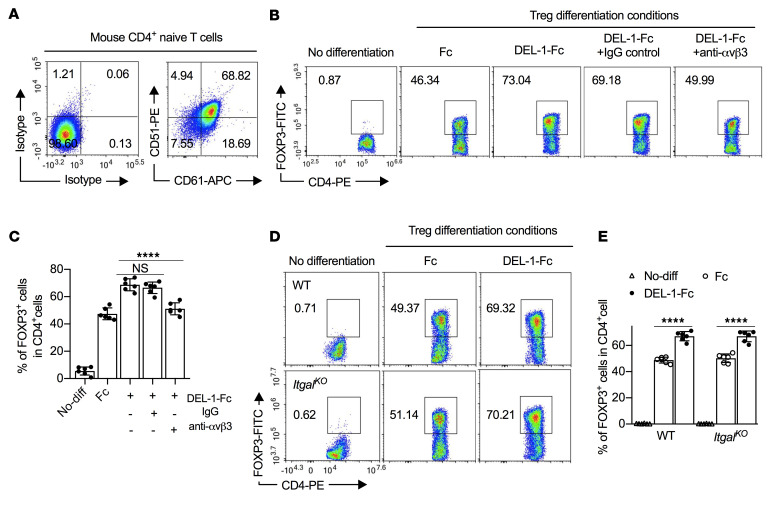
Figure 6. DEL-1 enhances FOXP3 expression in Tregs in a β3 integrin–dependent manner.
(A) FACS plots of CD51 (αv) and CD61 (β3) expression on mouse naive splenic CD4+ T cells. (B and C) Naive splenic CD4+ cells isolated from WT mice were differentiated, or not, into Tregs in medium containing anti-CD3/anti-CD28, TGF-β1 (5 ng/mL), IL-2 (40 ng/mL), and Fc control or DEL-1–Fc (10 μg/mL) in the presence or not of IgG control or anti-αvβ3 antibody (10 μg/mL; added 15 minutes before DEL-1–Fc treatment). Shown are (B) FACS plots and (C) data analysis of the percentage of FOXP3+ cells in CD4+ T cells from the in vitro culture system on day 4 (n = 6 replicates from 2 separate cell isolations). (D and E) Naive splenic CD4+ cells isolated from WT and ItgalKO mice were differentiated, or not, into Tregs in medium containing anti-CD3/anti-CD28, TGF-β1 (5 ng/mL), IL-2 (40 ng/mL), and Fc control or DEL-1–Fc (10 μg/mL). Shown are (D) FACS plots and (E) data analysis of the percentage of FOXP3+ cells in CD4+ T cells from the in vitro culture system on day 4 (n = 6 replicates from 2 separate cell isolations). Data are means ± SD and are pooled from 2 independent experiments. ****P < 0.0001 between indicated groups by 1-way ANOVA with Dunnett’s post hoc test for comparisons with DEL-1–Fc treatment (C) or by 2-tailed Student’s t test (E). NS, not significant.

