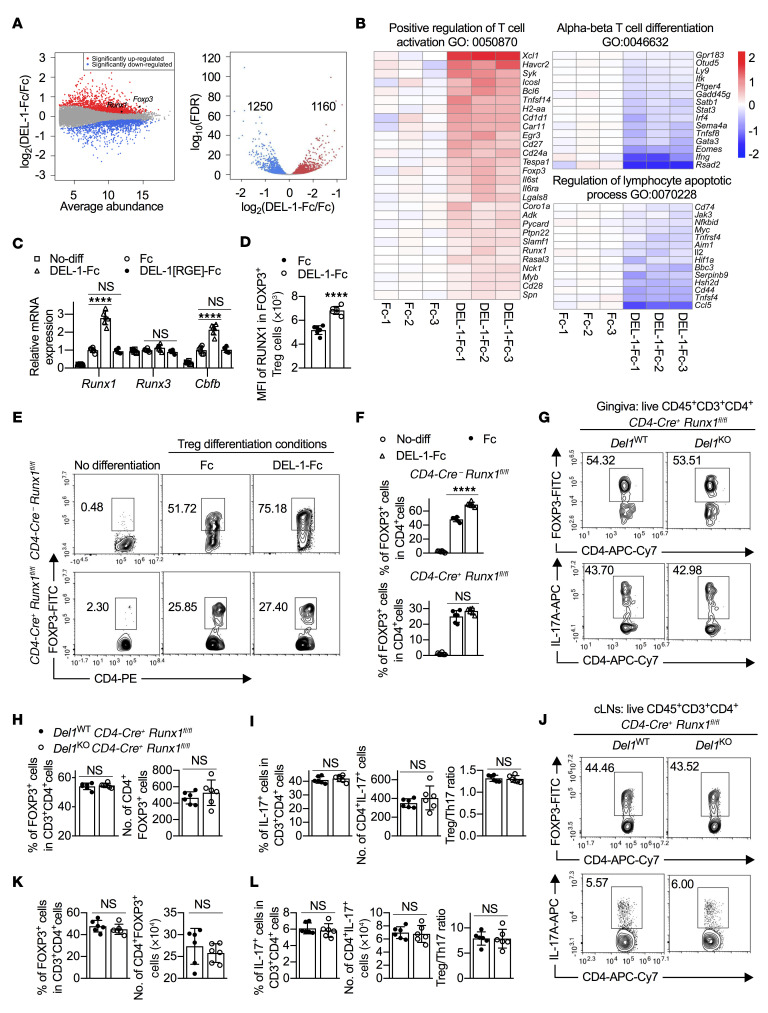
Figure 7. RUNX1 is required for the ability of DEL-1 to induce Treg differentiation.
(A and B) Naive splenic CD4+ cells from WT mice were differentiated into Tregs in the presence of DEL-1–Fc or Fc control for 3 days. RNA-seq analysis of the Treg transcriptome is presented as expression in the DEL-1–Fc group relative to the Fc control (log2 values) (n = 3 biological repeats/group). (A) MA (left) and volcano (right) plots show the distribution of gene expression. (B) Heatmaps show the significantly regulated genes (FDR < 0.05) annotated with ontology terms (Gene Ontology [GO] and PANTHER protein class). (C) Relative mRNA expression of Runx1, Runx3, and Cbfb in Tregs in in vitro culture on day 3 by qPCR (n = 6 replicates; 2 separate cell isolations). (D) MFI of RUNX1 in RUNX1+FOXP3+ iTregs (n = 6 replicates; 2 separate cell isolations). (E and F) Naive splenic CD4+ cells from CD4-Cre+ Runx1fl/fl mice or CD4-Cre– Runx1fl/fl littermate controls were differentiated, or not, into Tregs in the presence of Fc control or DEL-1–Fc for 4 days. (E) FACS plots and (F) percentage of FOXP3+ cells in CD4+ T cells from the in vitro culture system on day 4 (n = 6 replicates; 2 separate cell isolations). (G–L) Groups of littermate Del1WT CD4-Cre+ Runx1fl/fl and Del1KO CD4-Cre+ Runx1fl/fl mice were subjected to ligature-induced periodontitis for 10 days and ligatures were removed on day 10 for 5 days. FACS plots of Tregs (top) and Th17 cells (bottom) in gingival tissues (G) and cLNs (J) and percentages and absolute numbers of Tregs (H and K) and Th17 cells as well as Treg/Th17 cell ratio (I and L) in gingival tissues (H and I) and cLNs (K and L) of littermate Del1WT CD4-Cre+ Runx1fl/fl and Del1KO CD4-Cre+ Runx1fl/fl mice on day 15 (n = 6 mice/group). Data are means ± SD and are pooled from 2 independent experiments. ****P < 0.0001 by 1-way ANOVA with Dunnett’s post hoc test for comparison with Fc control (C) or 2-tailed Student’s t test (D, F, H, I, K, and L). NS, not significant.

