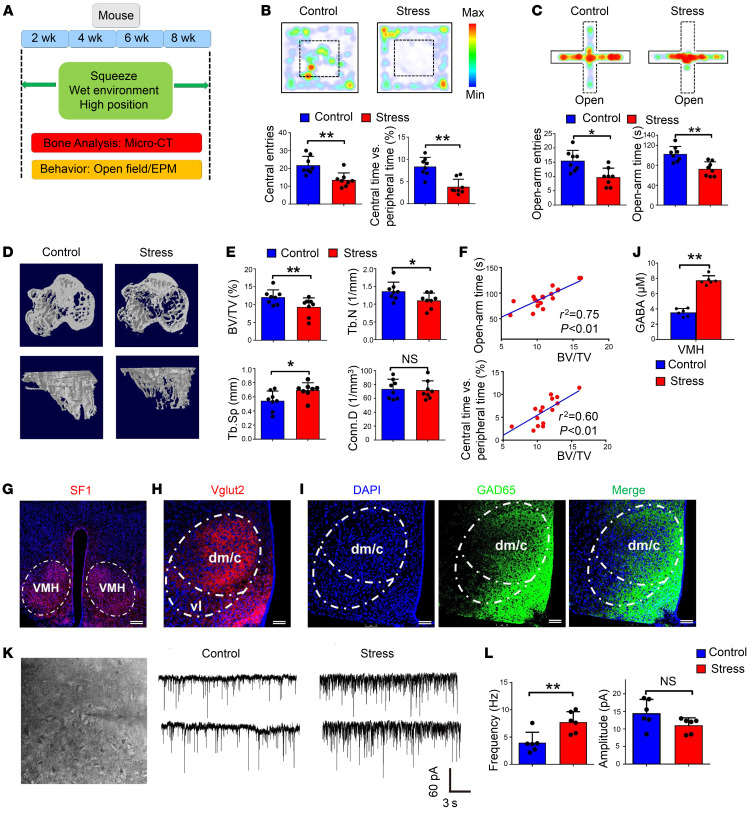
Figure 1. A mouse model of chronic stress–induced anxiety-like behavior and bone loss.
(A) Schematic showing generation of the unpredictable chronic mild stress–induced anxiety mouse model. (B) Open-field (OF) test comparing the stress and control groups. Mice in the stress group exhibited significantly fewer entries to the central area and spent less time exploring the central area. Values represent mean ± SD (n = 8 per group; **P < 0.01; Student’s t test). (C) Elevated plus maze (EPM) test comparing stress and control groups. Mice in the stress group exhibited significantly fewer entries to the open arms and spent less time there. Values represent mean ± SD (n = 8 per group; *P < 0.05, **P < 0.01; Student’s t test). (D) Representative coronal (top) and sagittal (bottom) plane images of proximal tibia. Mice in the stress group displayed a low–bone mass phenotype. (E) Micro-CT analysis of trabecular bone volume/tissue volume (BV/TV), trabecular number (TbN), trabecular separation (Tb.Sp), and connectivity density (Conn.D) in the stress and control groups. Values represent mean ± SD (n = 8 per group; *P < 0.05, **P < 0.01; Student’s t test). (F) Correlation analysis of BV/TV and time spent in central area/open arms (n = 16). (G) Immunostaining of SF1 neurons in the VMH. Scale bar: 150 μm. (H) Immunostaining of vesicular glutamate transporter (Vglut2) in the VMHdm. Scale bar: 75 μm. dm/c, dorsomedial and central parts of the VMH; vl, ventrolateral part of the VMH (I) Immunostaining of GAD65-positive GABAergic projections in the VMHdm. Scale bar: 75 μm. (J) Quantification of GABA levels in the VMHdm region in stress and control groups. Values represent mean ± SD (n = 6 per group; **P < 0.01; Student’s t test). (K) Representative inhibitory postsynaptic currents (IPSCs) of SF1 neurons in the VMHdm in the stress and control groups. (L) Quantification of the frequency and amplitude of IPSCs from SF1 neurons in the stress and control groups. Values represent mean ± SD (n = 6 per group; **P < 0.01; Student’s t test).

