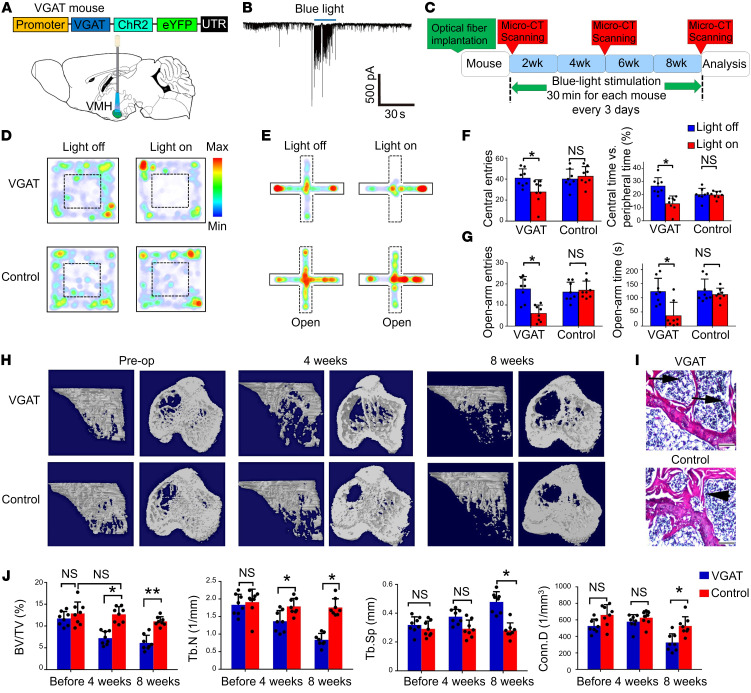
Figure 2. Activation of GABAergic projections in the VMHdm induces anxiety-like behaviors and bone loss.
(A) Optical fibers were implanted into the VMHdm of VGAT-ChR2 mice, and the region was illuminated with blue light. (B) Electrophysiological recording of a typical IPSC from SF1 neurons during blue-light stimulation. (C) Schematic showing the schedule of blue-light stimulation and bone analysis with intermittent micro-CT scanning. (D) OF test of VGAT and control mice before and during blue-light stimulation. VGAT mice displayed obvious anxiety-like behavior. (E) EPM test of VGAT and control mice before and during blue-light stimulation. VGAT mice displayed obvious anxiety-like behavior. (F) Quantification of entries to, and time spent in, the central area before and during blue-light stimulation in the VGAT and control groups. Values represent mean ± SD (n = 8 per group; *P < 0.05; 1-way ANOVA with Bonferroni’s correction for comparisons). (G) Quantification of entries to, and time spent in, the open arms in the VGAT and control groups before and during blue-light stimulation. Values represent mean ± SD (n = 8 per group; *P < 0.05; 1-way ANOVA with Bonferroni’s correction for multiple comparisons). (H) Micro-CT analysis of VGAT and control group bone structure before, during, and after blue-light stimulation. A significantly low–bone mass phenotype was observed in the VGAT group 4 and 8 weeks after light stimulation began. (I) H&E staining of the proximal tibia in the VGAT and control groups at 8 weeks after stimulation. Scale bars: 200 μm. (J) Micro-CT analysis of BV/TV, TbN, Tb.Sp, and Conn.D in the VGAT and control groups. Values represent mean ± SD (n = 8 per group; *P < 0.05, **P < 0.01; 1-way ANOVA with Bonferroni’s correction for multiple comparisons).

