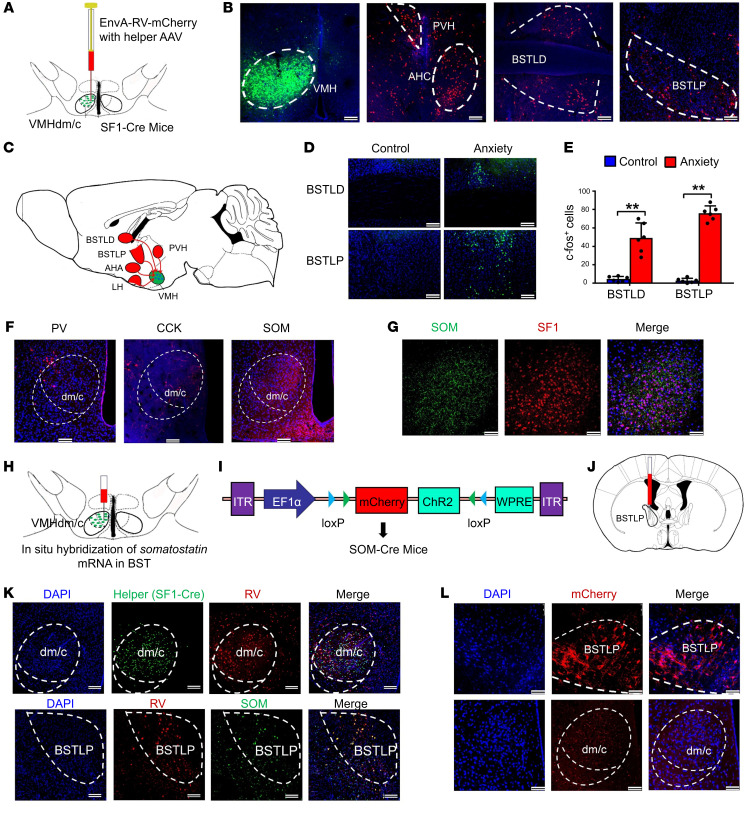
Figure 3. Somatostatin neurons in the posterior BNST send GABAergic projections to the VMHdm region.
(A) Schematic showing rabies virus–based (RV-based) monosynaptic retrograde tracing in the SF1-Cre mice. (B) Representative images of the VMH region with the helper AAV virus expressing eYFP, and of RV-labeled cells (red) in different brain regions. PVH, paraventricular nucleus of the hypothalamus; AHC, anterior hypothalamic nucleus; BSTLD, lateral dorsal BNST; BSTLP, lateral posterior BNST. Scale bars: 100 μm. (C) Schematic mapping of neural circuits from different brain regions to the VMH through monosynaptic neural connection. AHA, anterior hypothalamic area; LH, lateral hypothalamic area. (D) c-fos staining of the BSTLD and BSTLP regions in the anxiety and control groups. Scale bars: 100 μm. (E) Quantification of c-fos–positive cells in the anxiety and control groups. Values represent mean ± SD (n = 3 mice per group; **P < 0.01; 1-way ANOVA with Bonferroni’s correction for multiple comparisons). (F) Immunostaining of neural projections in VMH. PV, parvalbumin; CCK, cholecystokinin; SOM, somatostatin. Scale bars: 100 μm. (G) Double staining of SF1 neurons and SOM-positive projections in VMHdm. Scale bars: 50 μm. (H) RV was injected unilaterally into the dmVMH in SF1-Cre mice, and in situ hybridization of somatostatin mRNA in the posterior region of the BNST (BNSTLP) is shown. (I) Schematic showing AAV9 expressing mCherry and ChR2 under the EF1α promoter. (J) Schematic showing virus injection into the BNSTLP of SOM-Cre mice. (K) Top: The RV was injected unilaterally into the VMHdm in SF1-Cre mice. Bottom: In situ hybridization of somatostatin mRNA in the BSTLP region. RV signals and somatostatin mRNA were colocalized in the BSTLP region. Scale bars: 100 μm. (L) Representative image of SOM-positive neurons in the BSTLP (top) and SOM-positive neural projections in the VMHdm (bottom) after injection into the BSTLP region. Scale bars: 100 μm.

