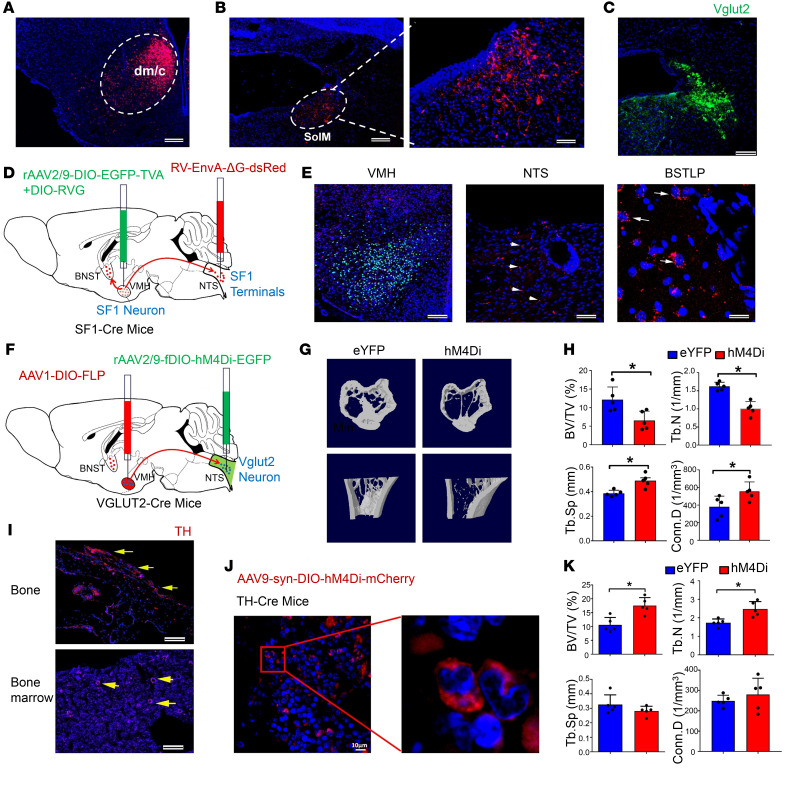
Figure 6. The NTS and the sympathetic system are downstream of SOM neuron–mediated stress-induced bone loss.
(A) Representative images of the VMH region with the virus expressing mCherry. Scale bar: 100 μm. (B) Representative image of neural projections in the SolM, a subregion of the NTS, receiving projections from SF1 neurons in the VMH. Scale bars: 100 μm (left), 50 μm (right). (C) Immunostaining of Vglut2 in the SolM region of the NTS. Scale bar: 50 μm. (D) Schematic showing viral genetic tracing of the connection of the BNST-VMH-NTS pathway using the TRIO method. AAV2-DIO-EGFP-TVA+DIO-RVG virus was injected into the VMH region, and RV-EnvA-ΔG-dsRed virus into the NTS, of SF1-Cre mice. (E) Representative images showing the labeled SF1 neurons in the VMH, SF1-projecting neural terminals in the NTS (arrowheads), and input neurons in the BSTLP region (arrows). (F) Schematic showing silencing of Vglut2 neurons innervated by SF1 neurons using the DREADD technique. AAV1-DIO-FLP virus was injected into the VMH region, and AAV-fDIO-hM4Di-eYFP virus into the NTS, of Vglut2-Cre mice. (G) Micro-CT analysis of bone structure of the eYFP and eYFP-hM4Di groups after inhibition of the Vglut2 neurons. A significant low–bone mass phenotype was observed in the hM4Di group. (H) Micro-CT analysis of BV/TV, TbN, Tb.Sp, and Conn.D in eYFP and hM4Di groups. Values represent mean ± SD (n = 5 per group; *P < 0.05; Student’s t test). (I) Immunostaining of tyrosine hydroxylase (TH) in bone and bone marrow. Positive signals were observed in both bone and bone marrow (arrows). Scale bars: 100 μm. (J) Expression of hM4Di-mCherry on TH-positive nerve fibers in bone marrow of TH-Cre mice. Scale bar: 10 μm. (K) Micro-CT analysis of BV/TV, TbN, Tb.Sp, and Conn.D in TH-Cre and TH-Cre+hM4Di groups. Values represent mean ± SD (n = 5 per group; *P < 0.05; Student’s t test).

