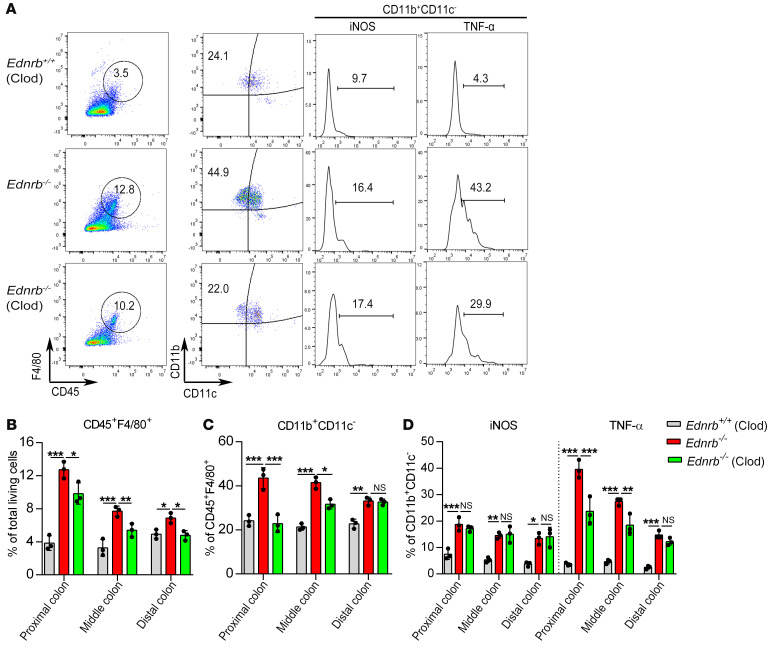
Figure 7. Proinflammatory M1 macrophages decrease in the proximal colon of 3-week-old Ednrb–/– mice after Clod treatment.
(A) Representative analysis of CD45+F4/80+, CD11b+CD11c–, iNOS+, and TNF-α+ cells in the proximal colon from 3-week-old Ednrb+/+ and Ednrb–/– mice treated with Clod. (B) Percentage of CD45+F4/80+ cells among total viable cells in colonic tissue. (C) Percentage of CD11b+CD11c– cells among CD45+F4/80+ cells. (D) Percentage of iNOS+ cells and TNF-α+ cells among CD11b+CD11c– cells. Data shown represent results from 3 independent experiments. One-way ANOVA: *P < 0.05; **P < 0.01; ***P < 0.001.

