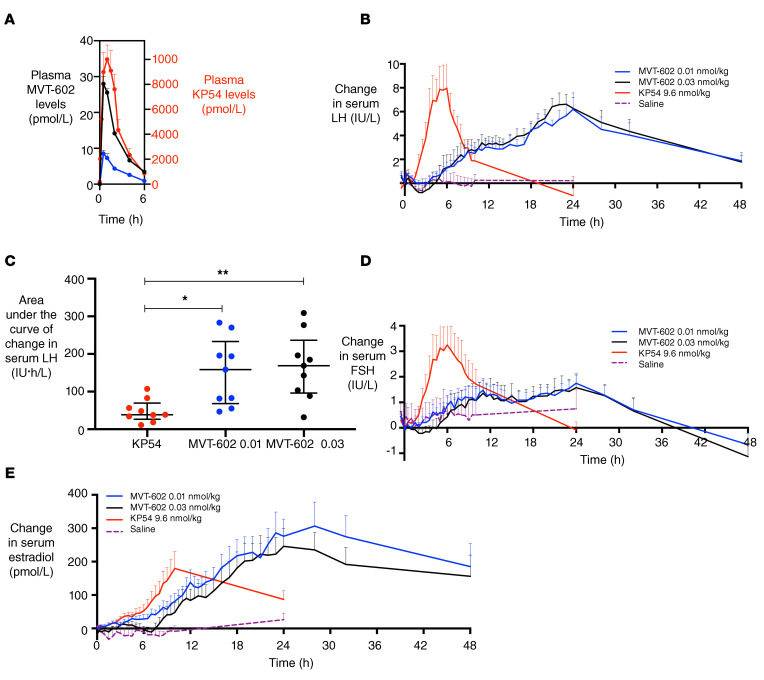
Figure 2. Clinical studies of MVT-602 and KP54 in healthy women in the follicular phase.
(A) Mean (± SEM) plasma concentration of MVT-602 (left y axis) or KP54 (right y axis) in pmol/L versus time (hours) in healthy women receiving an s.c. bolus of MVT-602 at 0.03 nmol/kg (blue) or 0.01 nmol/kg (black) or of KP54 (red) in the first 6 hours after s.c. administration at time 0 hours of each peptide. (B, D, and E) Mean (± SEM) change from baseline levels in serum LH (IU/L) (B), serum FSH (IU/L) (D), and serum estradiol (pmol/L) (E) in healthy women during the early follicular phase (n = 9) receiving an s.c. bolus of MVT-602 at time 0 hours. MVT-602 doses of 0.01 nmol/kg are presented in blue (over 48 hours), 0.03 nmol/kg MVT-602 in black (over 48 hours), 9.6 nmol/kg KP54 in red (over 24 hours), and 0.9% saline in purple (over 24 hours). (C) Median (IQR) of modeled values of AUC of serum LH (IU∙h/L) after KP54 (9.6 nmol/kg), MVT-602 (0.01 nmol/kg), and MVT-602 (0.03 nmol/kg). Groups were compared by Kruskal-Wallis test with post hoc Dunn’s multiple comparison. The duration of sampling was 24 hours for KP54, as LH had returned to baseline within this time frame, whereas it was 48 hours for MVT-602. *P < 0.05, **P < 0.01.

