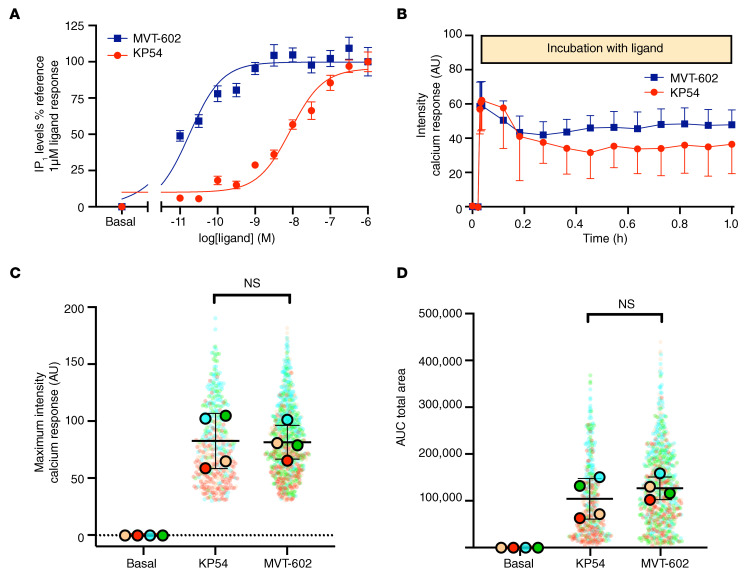
Figure 3. Effect of KP54 and MVT-602 on KISS1R-mediated Gαq/11 signaling via IP1 and Ca2+ activation.
(A) Intracellular levels of IP1 accumulation at varying concentrations of KP54 or MVT-602 following 45 minutes of stimulation in HEK293 cells expressing FLAG‑KISS1R. Data represent mean (± SEM) of n = 4 independent experiments conducted in triplicate wells and are normalized as a percentage of ligand response. (B) Intracellular Ca2+ levels measured by Fluo-4AM Ca2+ indicator dye and live confocal microscopy. Intensity profile produced following 10 nM stimulation with KP54 (red) or MVT-602 (blue) over 1 hour of chronic stimulation in cells transiently transfected with FLAG‑KISS1R of n = 4 independent experiments conducted in duplicate wells. Data are shown following subtraction of the average background intensity for each cell as described in Methods. (C and D) Maximum intensity (C) and total area under the curve (AUC) (D), calculated from data depicted in B following ligand treatments over 1 hour of chronic stimulation. Data show individual cell analysis (total number of cells: basal, n = 1324; KP54, n = 472; MVT-602, n = 852) overlaid with the mean (± SD) values of n = 4 independent experiments conducted in duplicate wells. Cells attributed to each biological repeat are shown in the corresponding color. There were no significant differences between KP54 and MVT-602 following analysis by 2-tailed, unpaired Student’s t test.

